ZEDCRIT TERMINAL
The First Multi-Paradigm Fusion Engine for 0DTE Options.
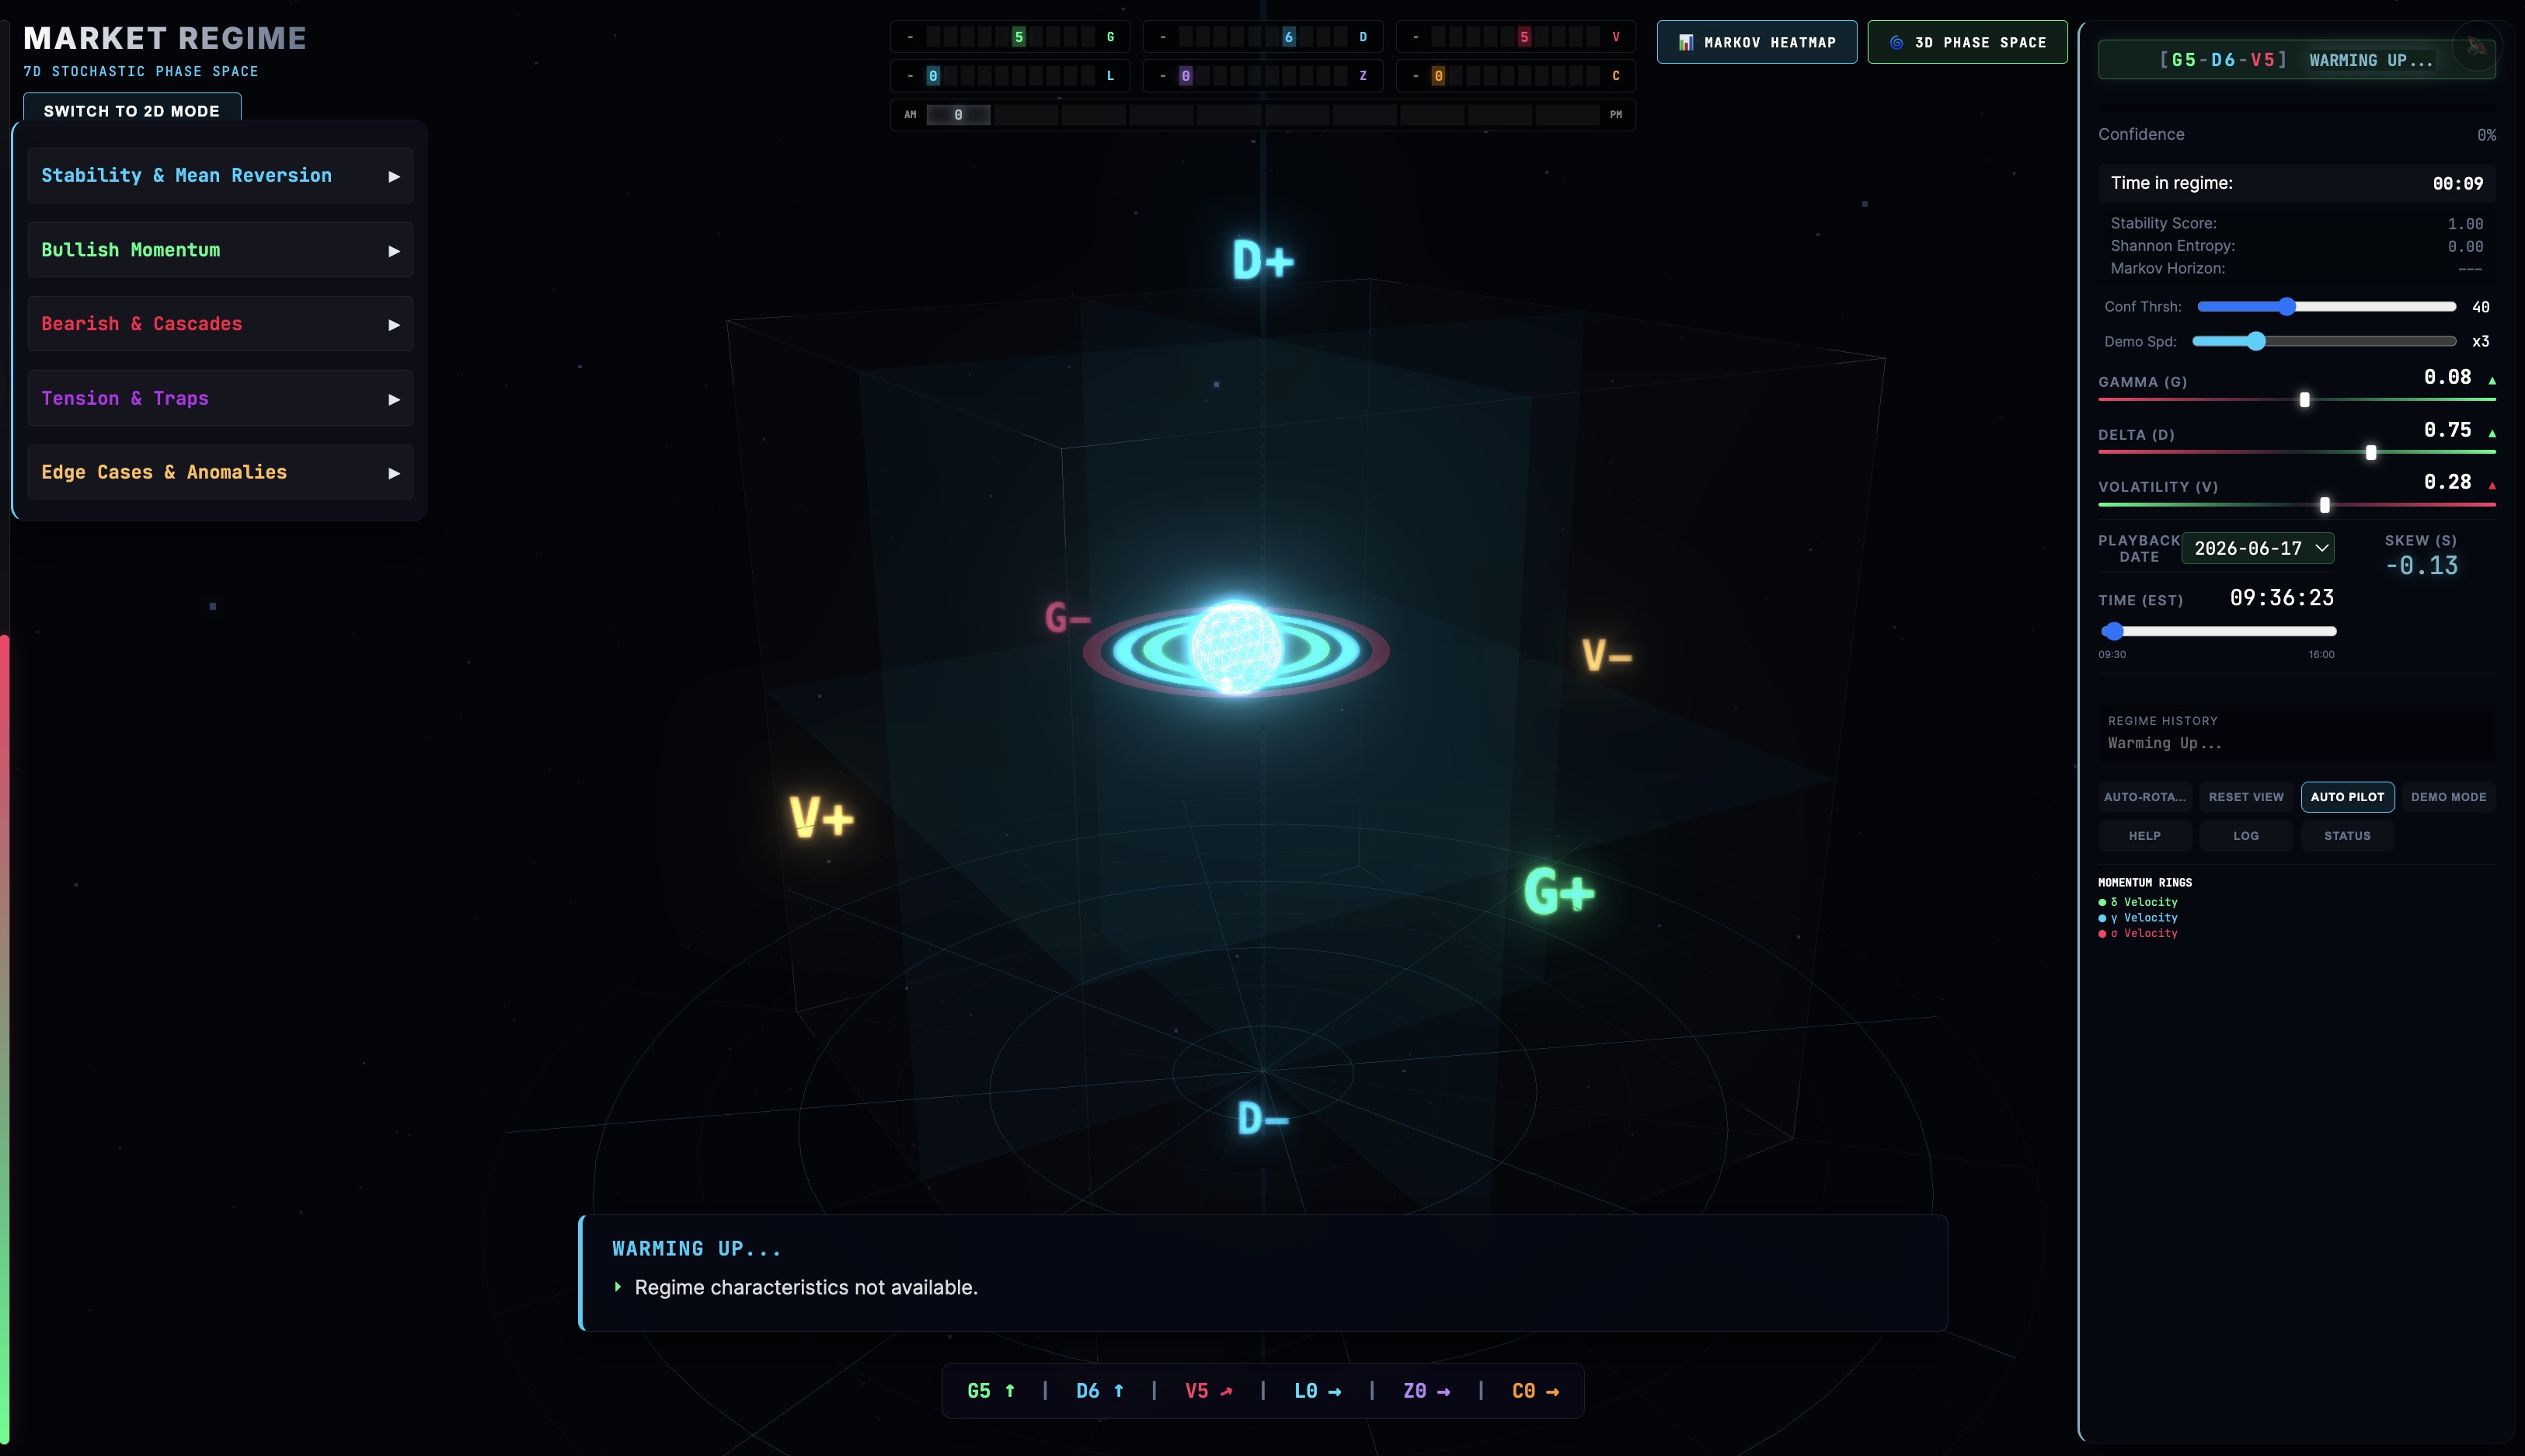
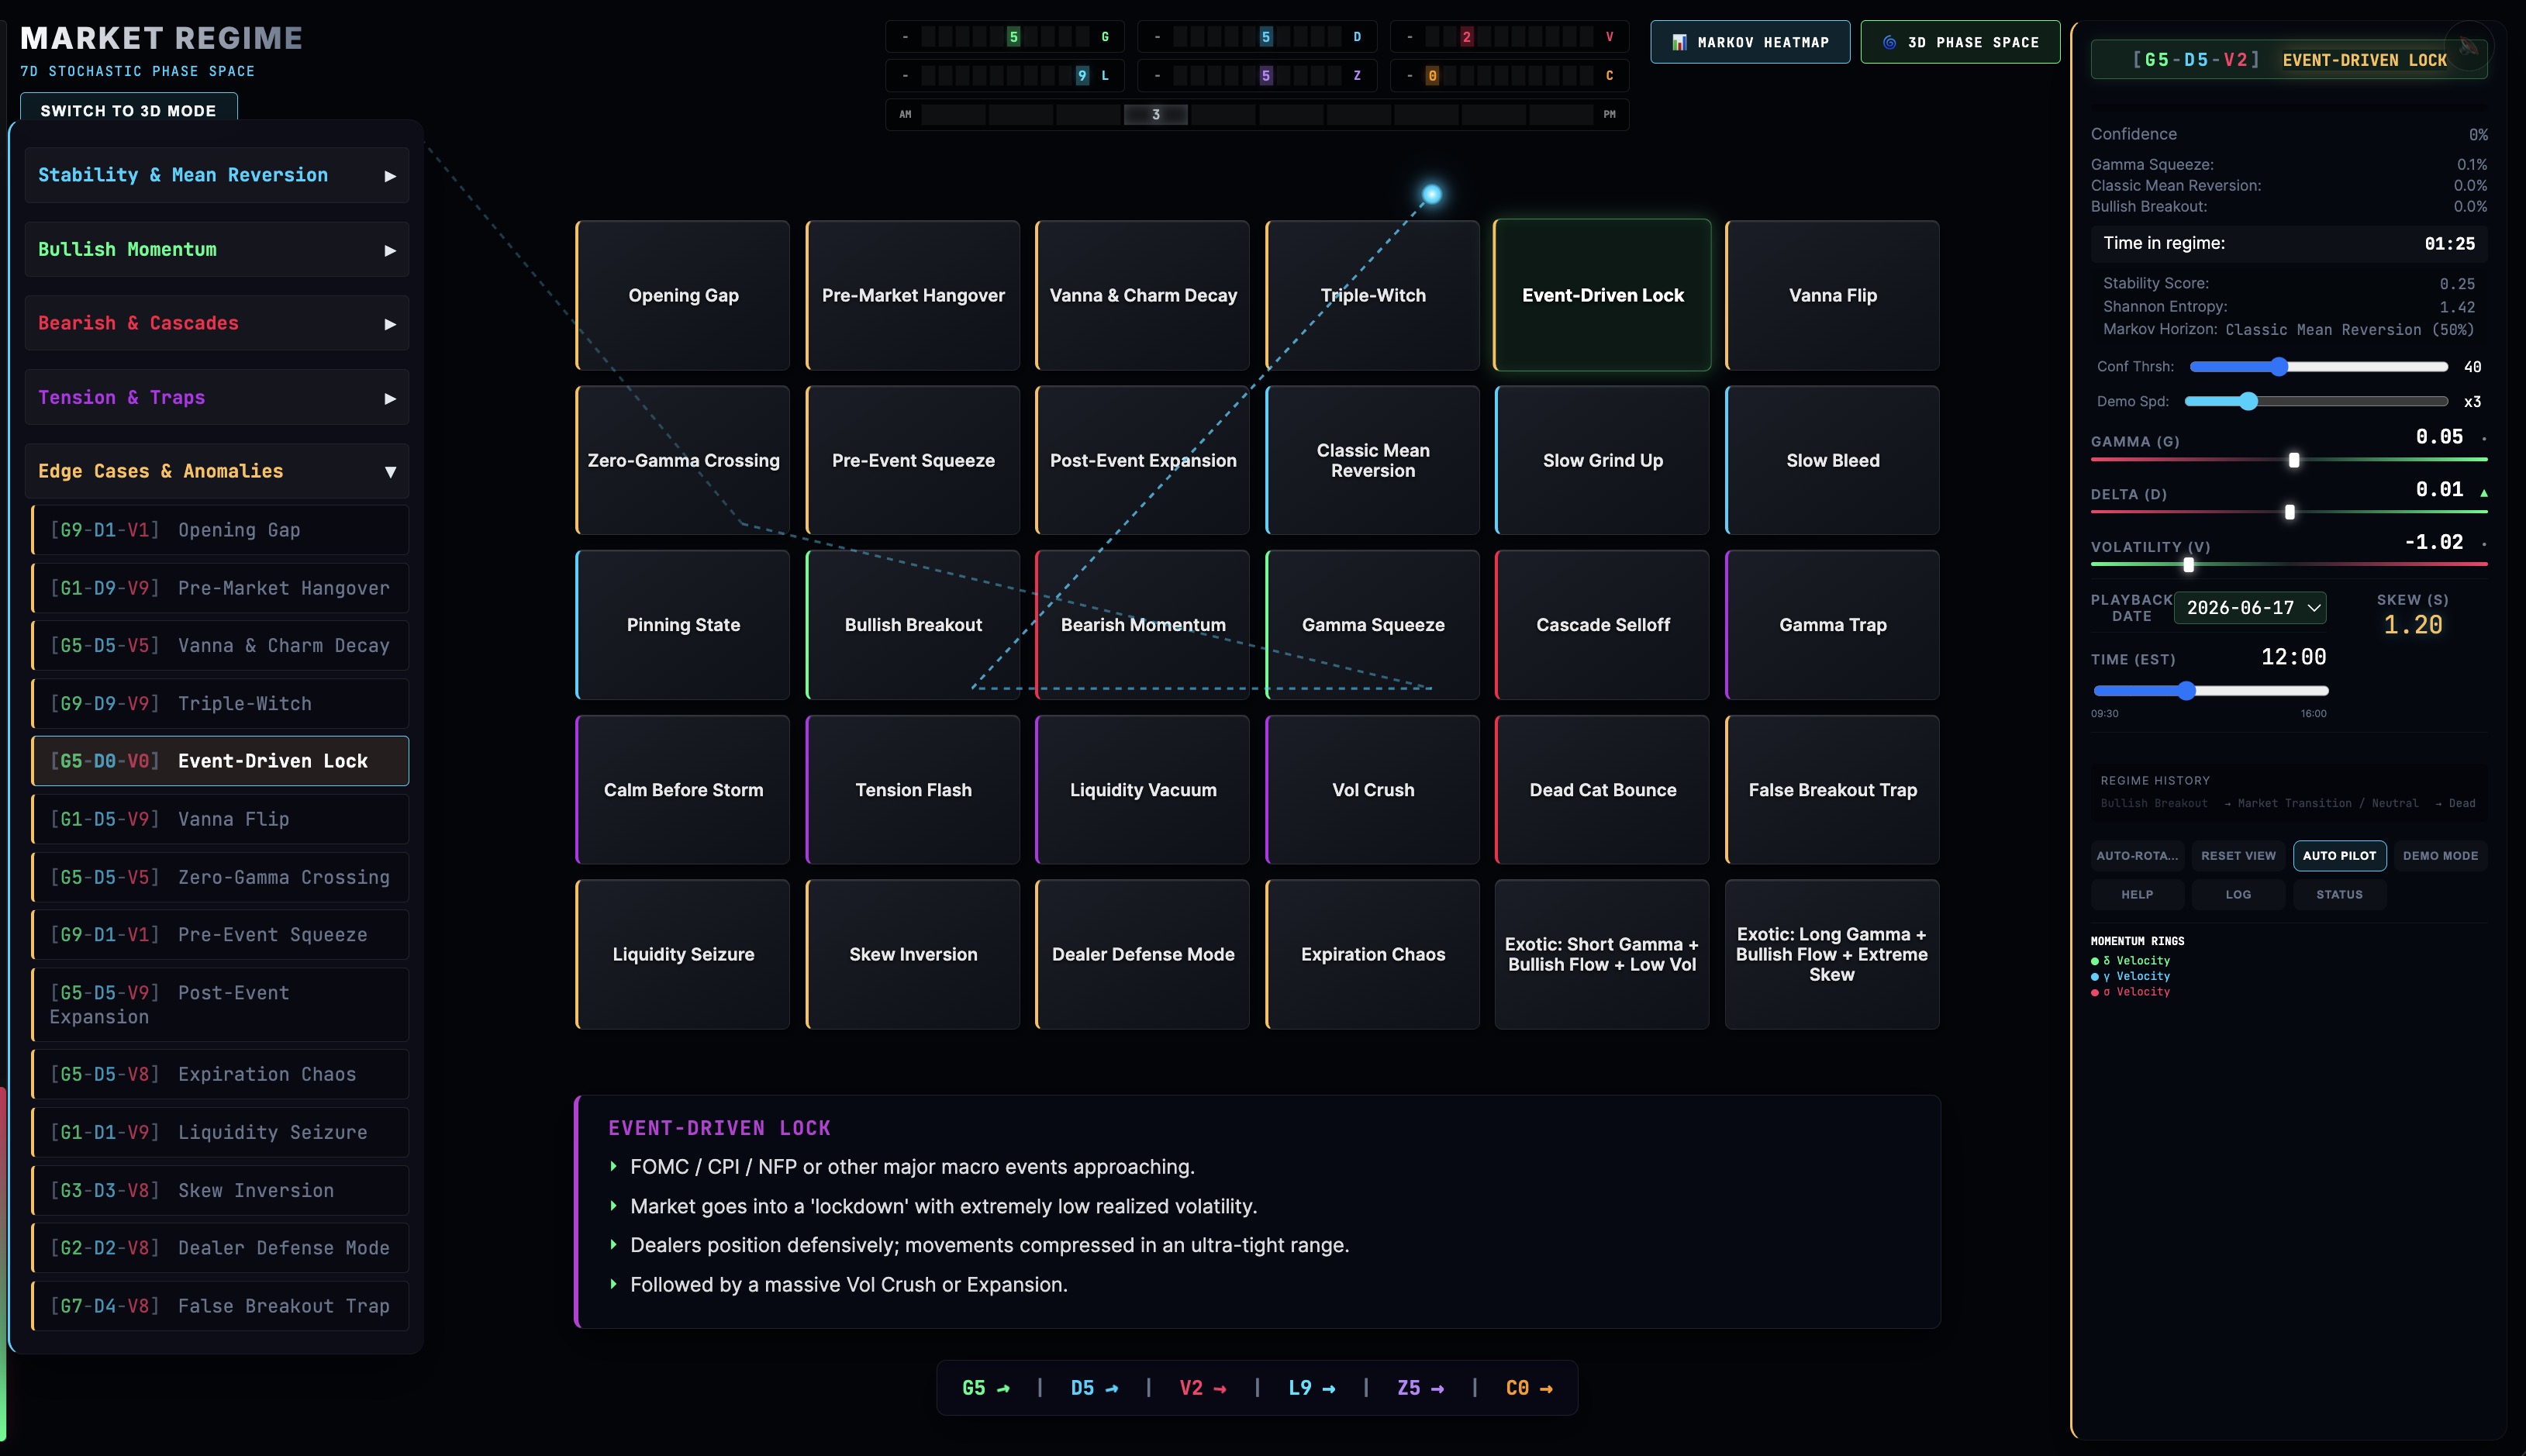
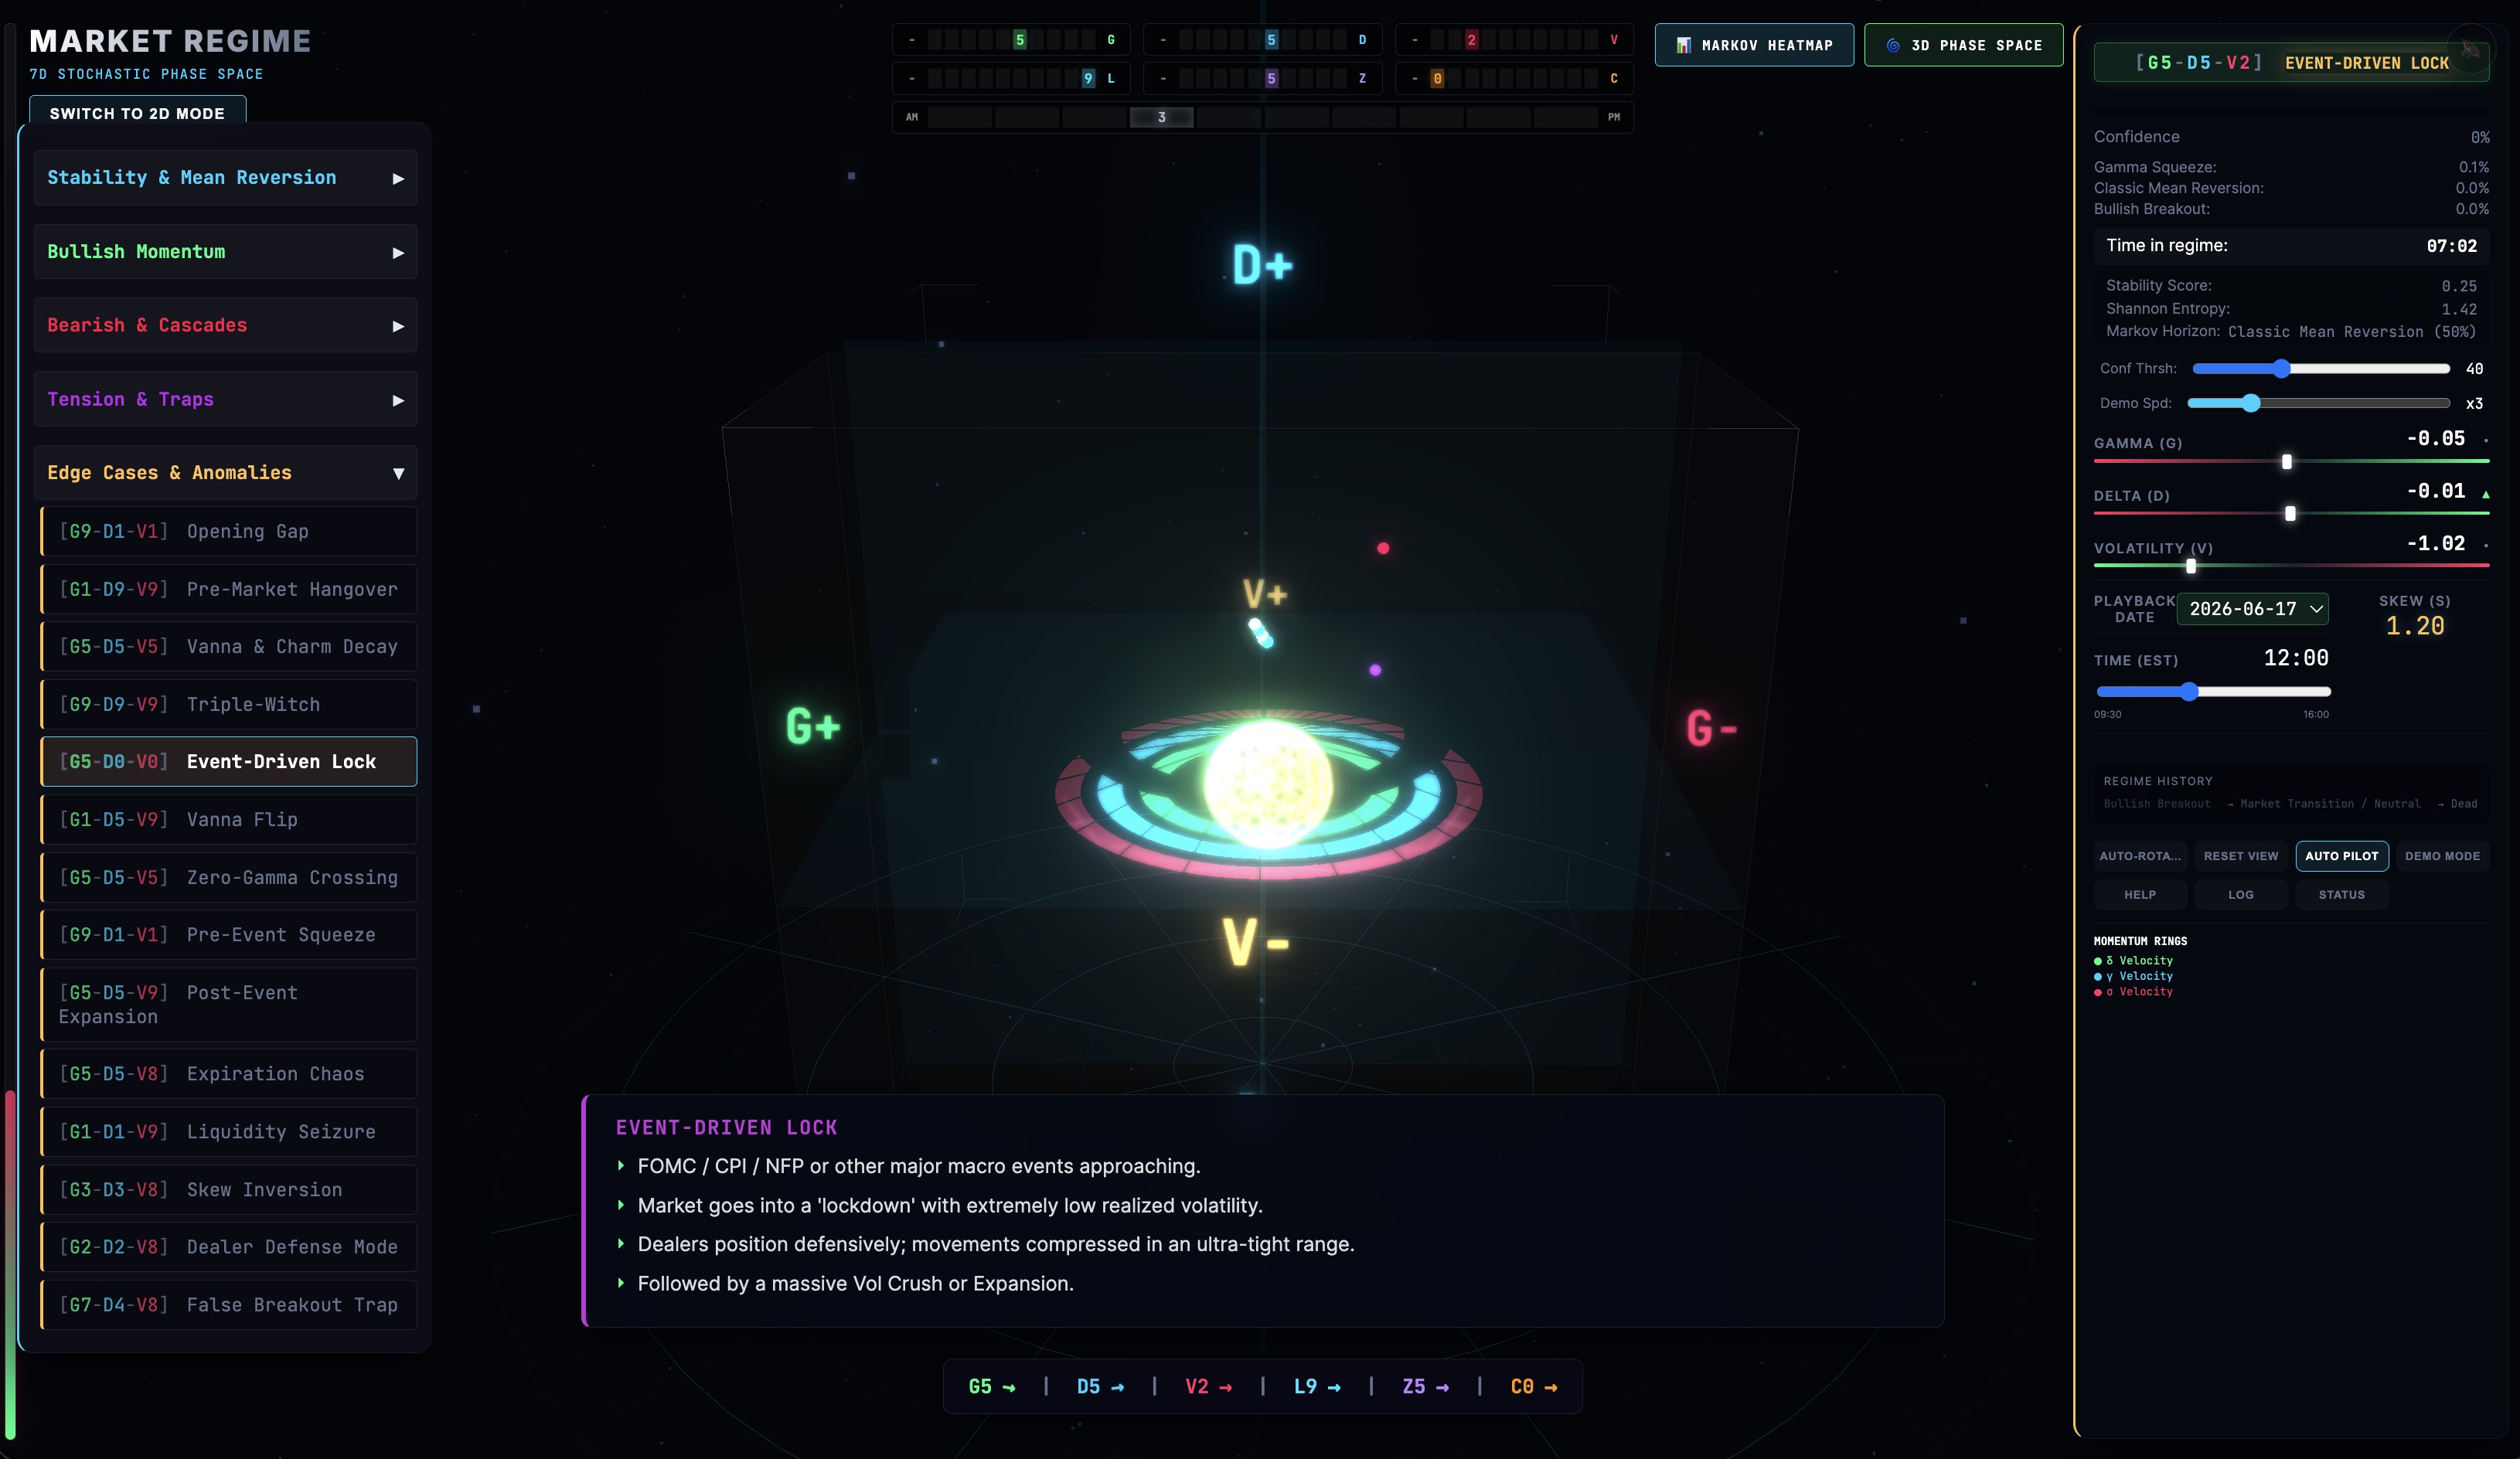
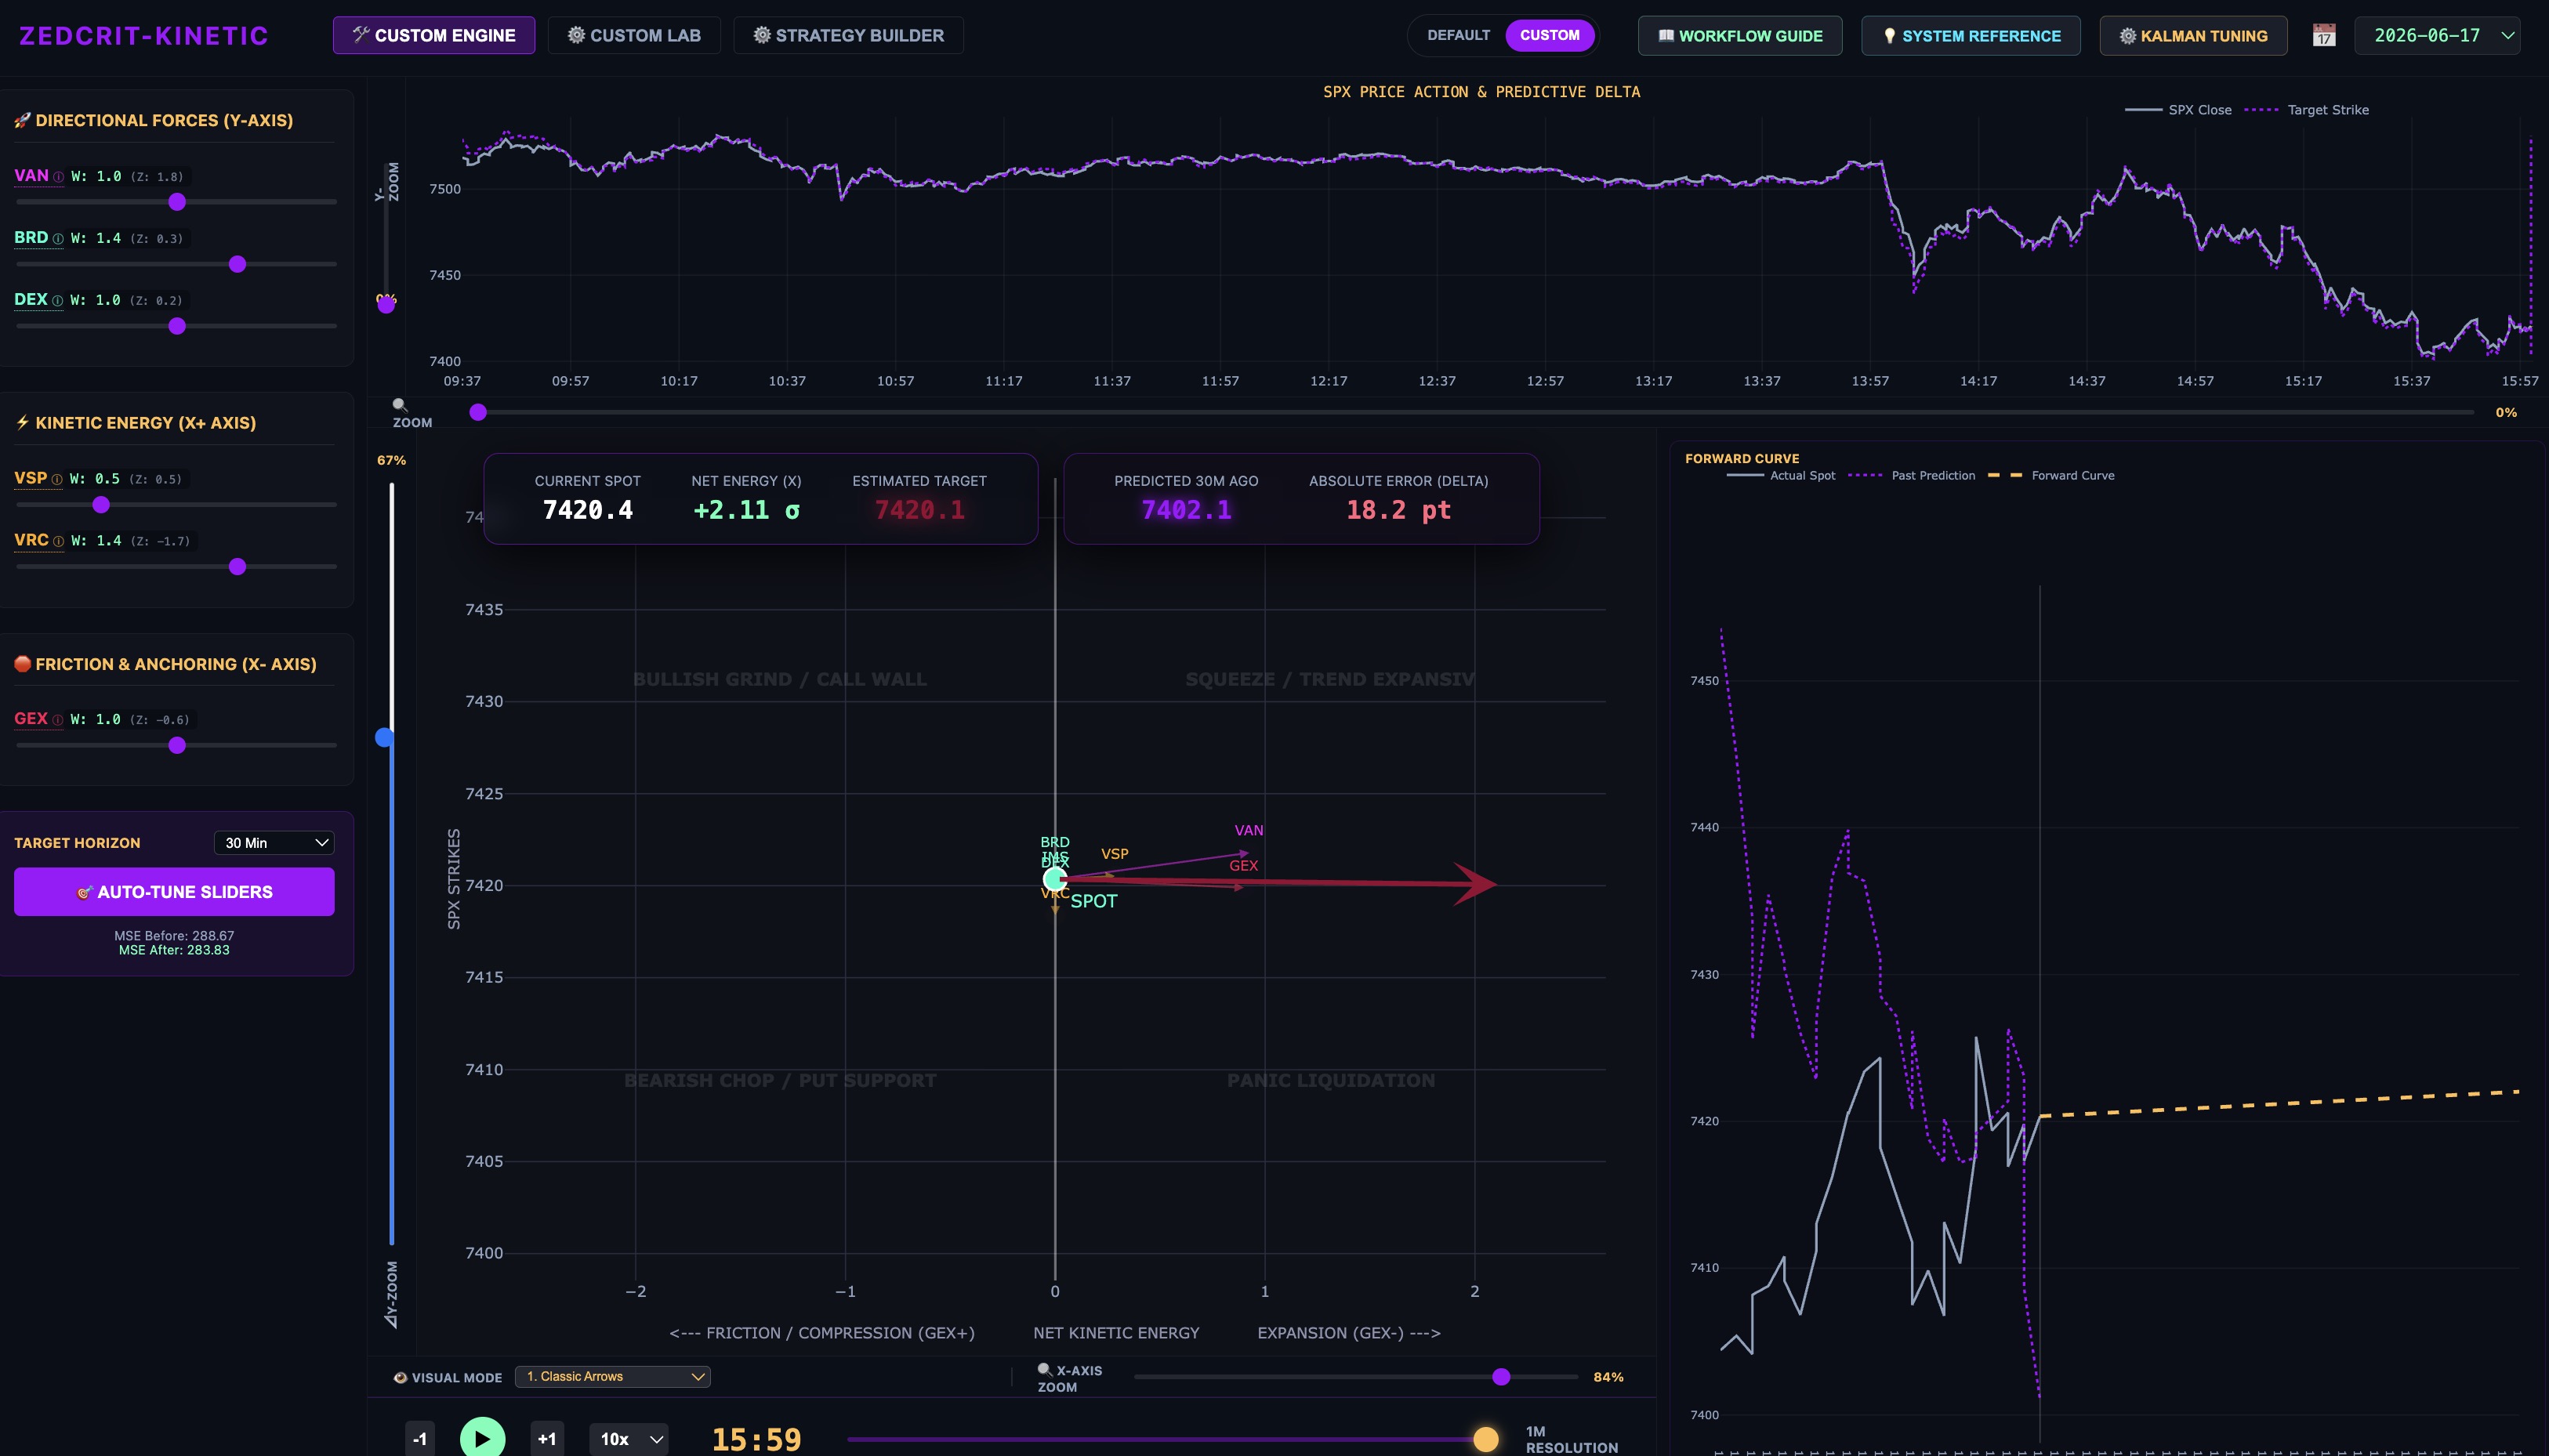
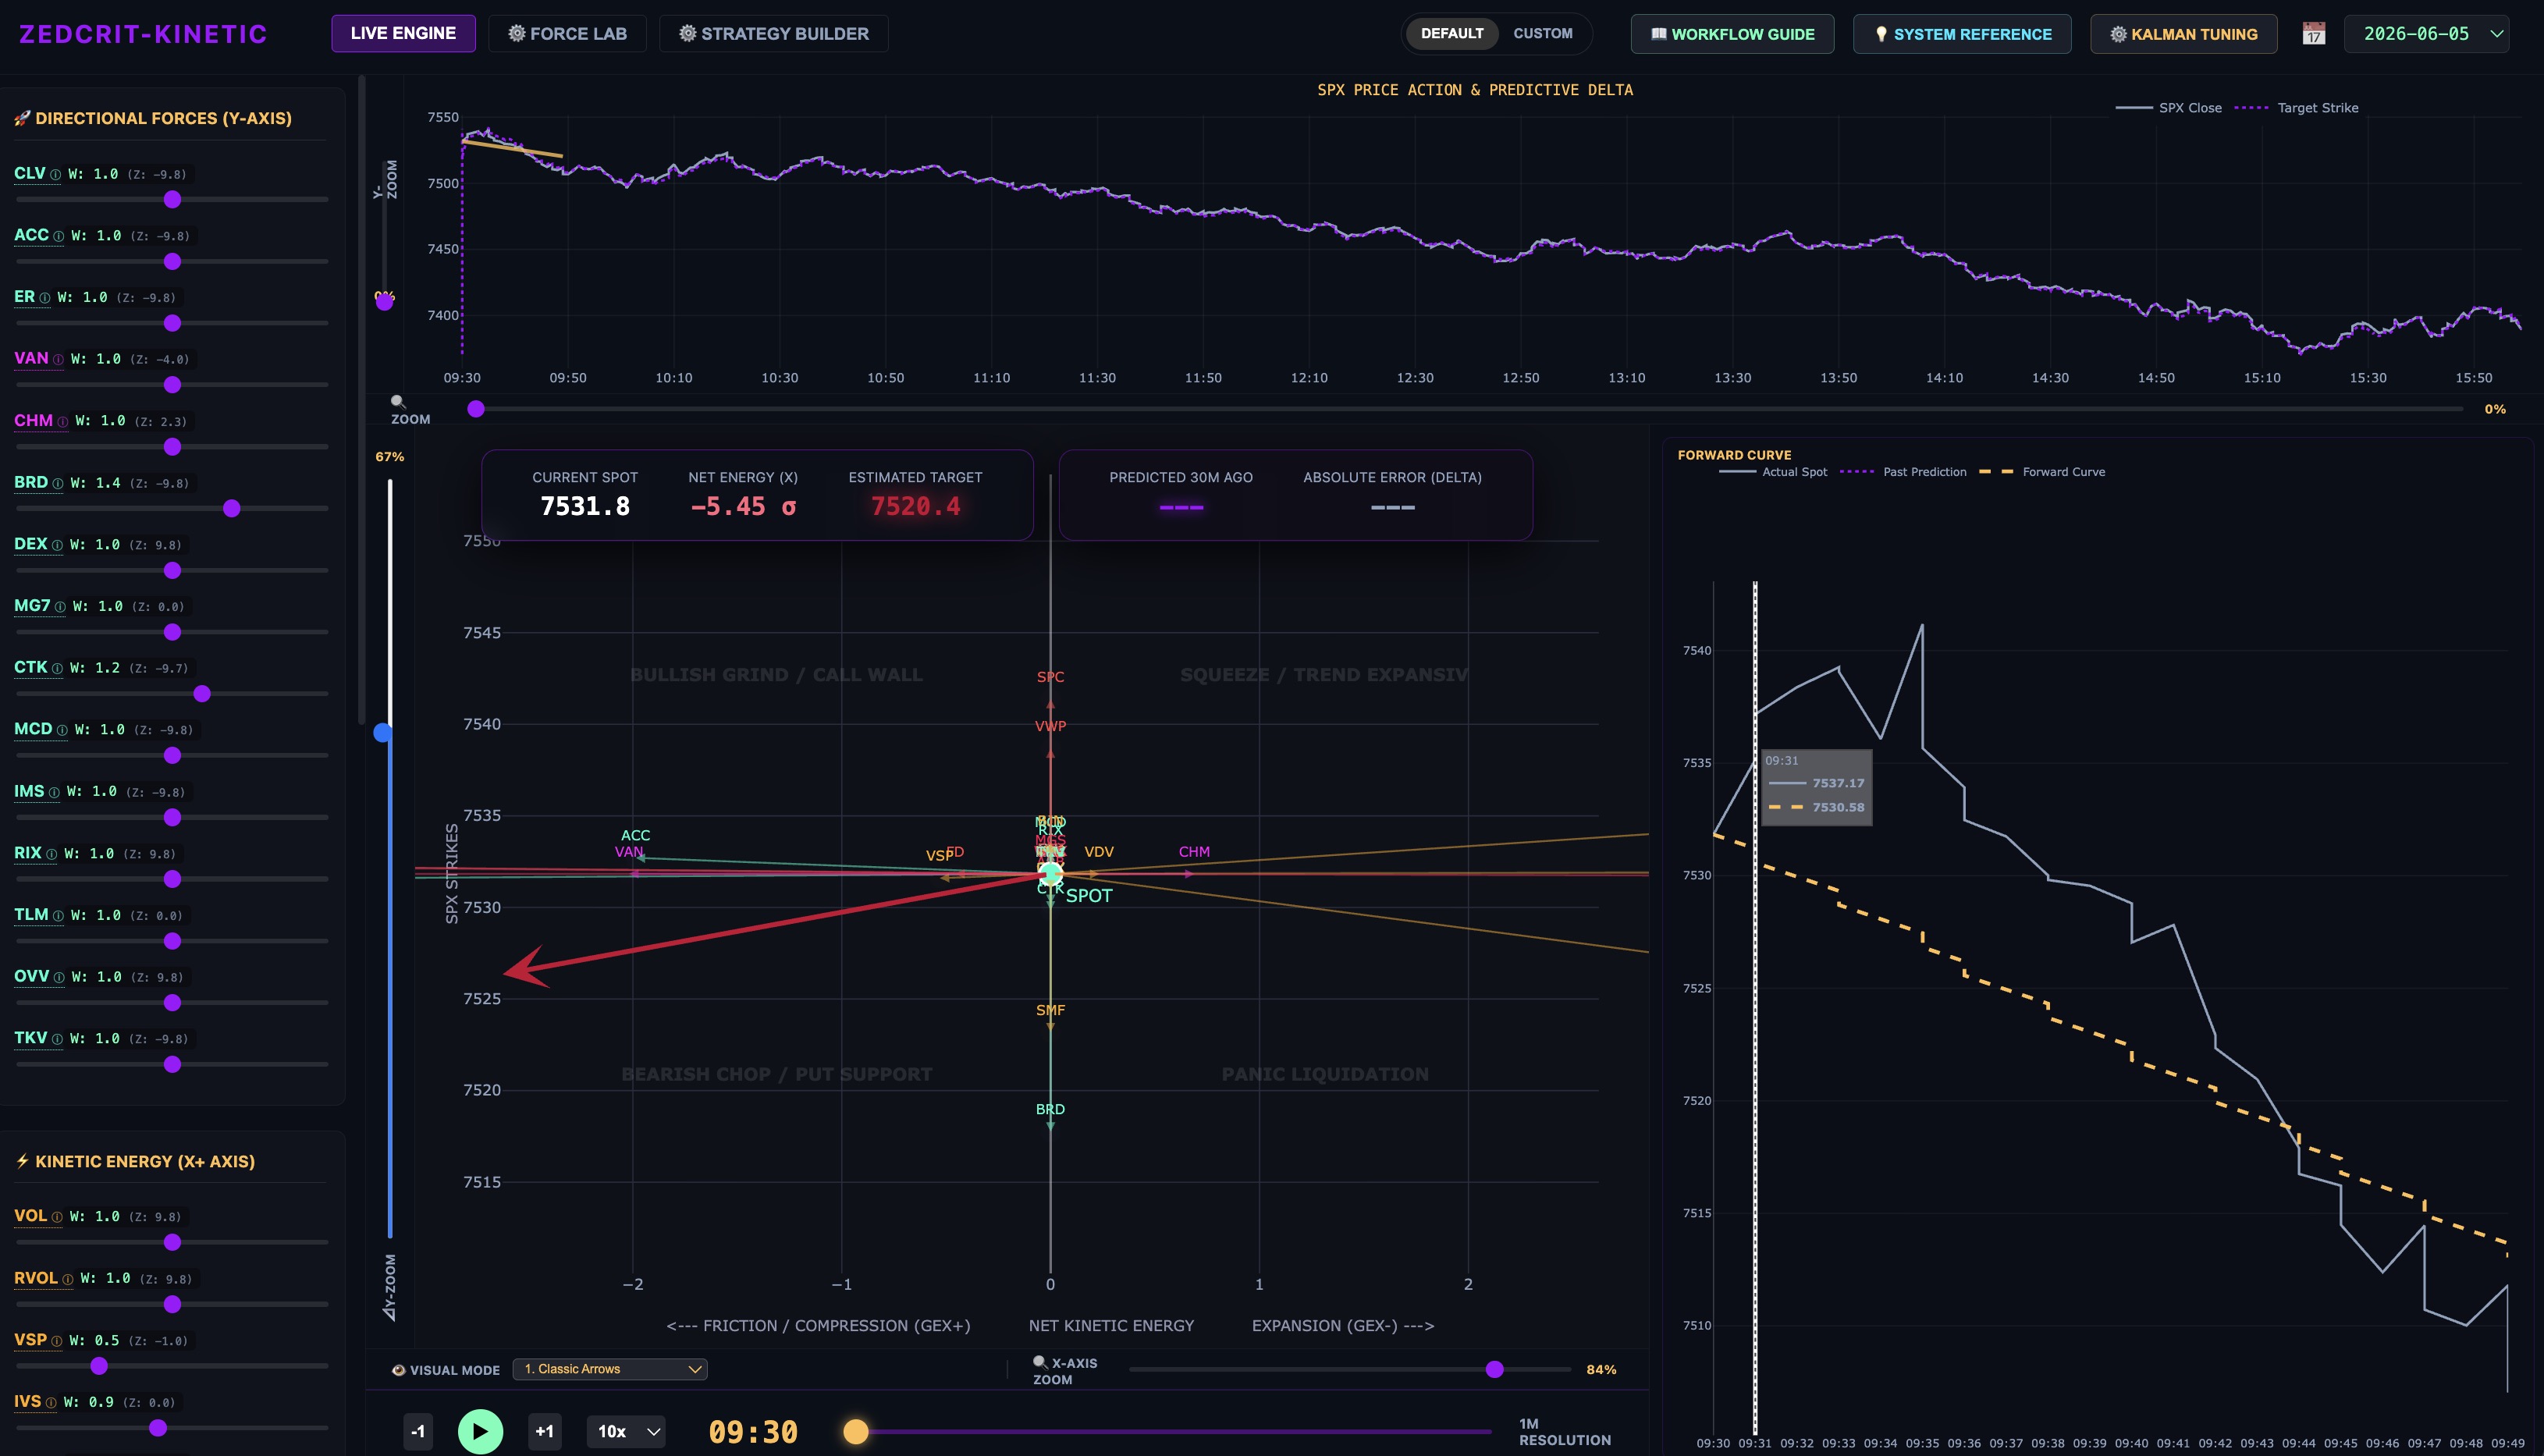
We fuse SEVEN mathematical paradigms — Kalman Innovation, GEX Analytics, Bayesian Inference, Institutional Flow, Machine Learning Calibration, Risk-Neutral Measures, and Extreme Value Theory — into a unified decision space. Think of it as a mathematical weather vane for 0DTE options — it doesn't predict the storm, it measures the exact direction and force of the institutional market winds.
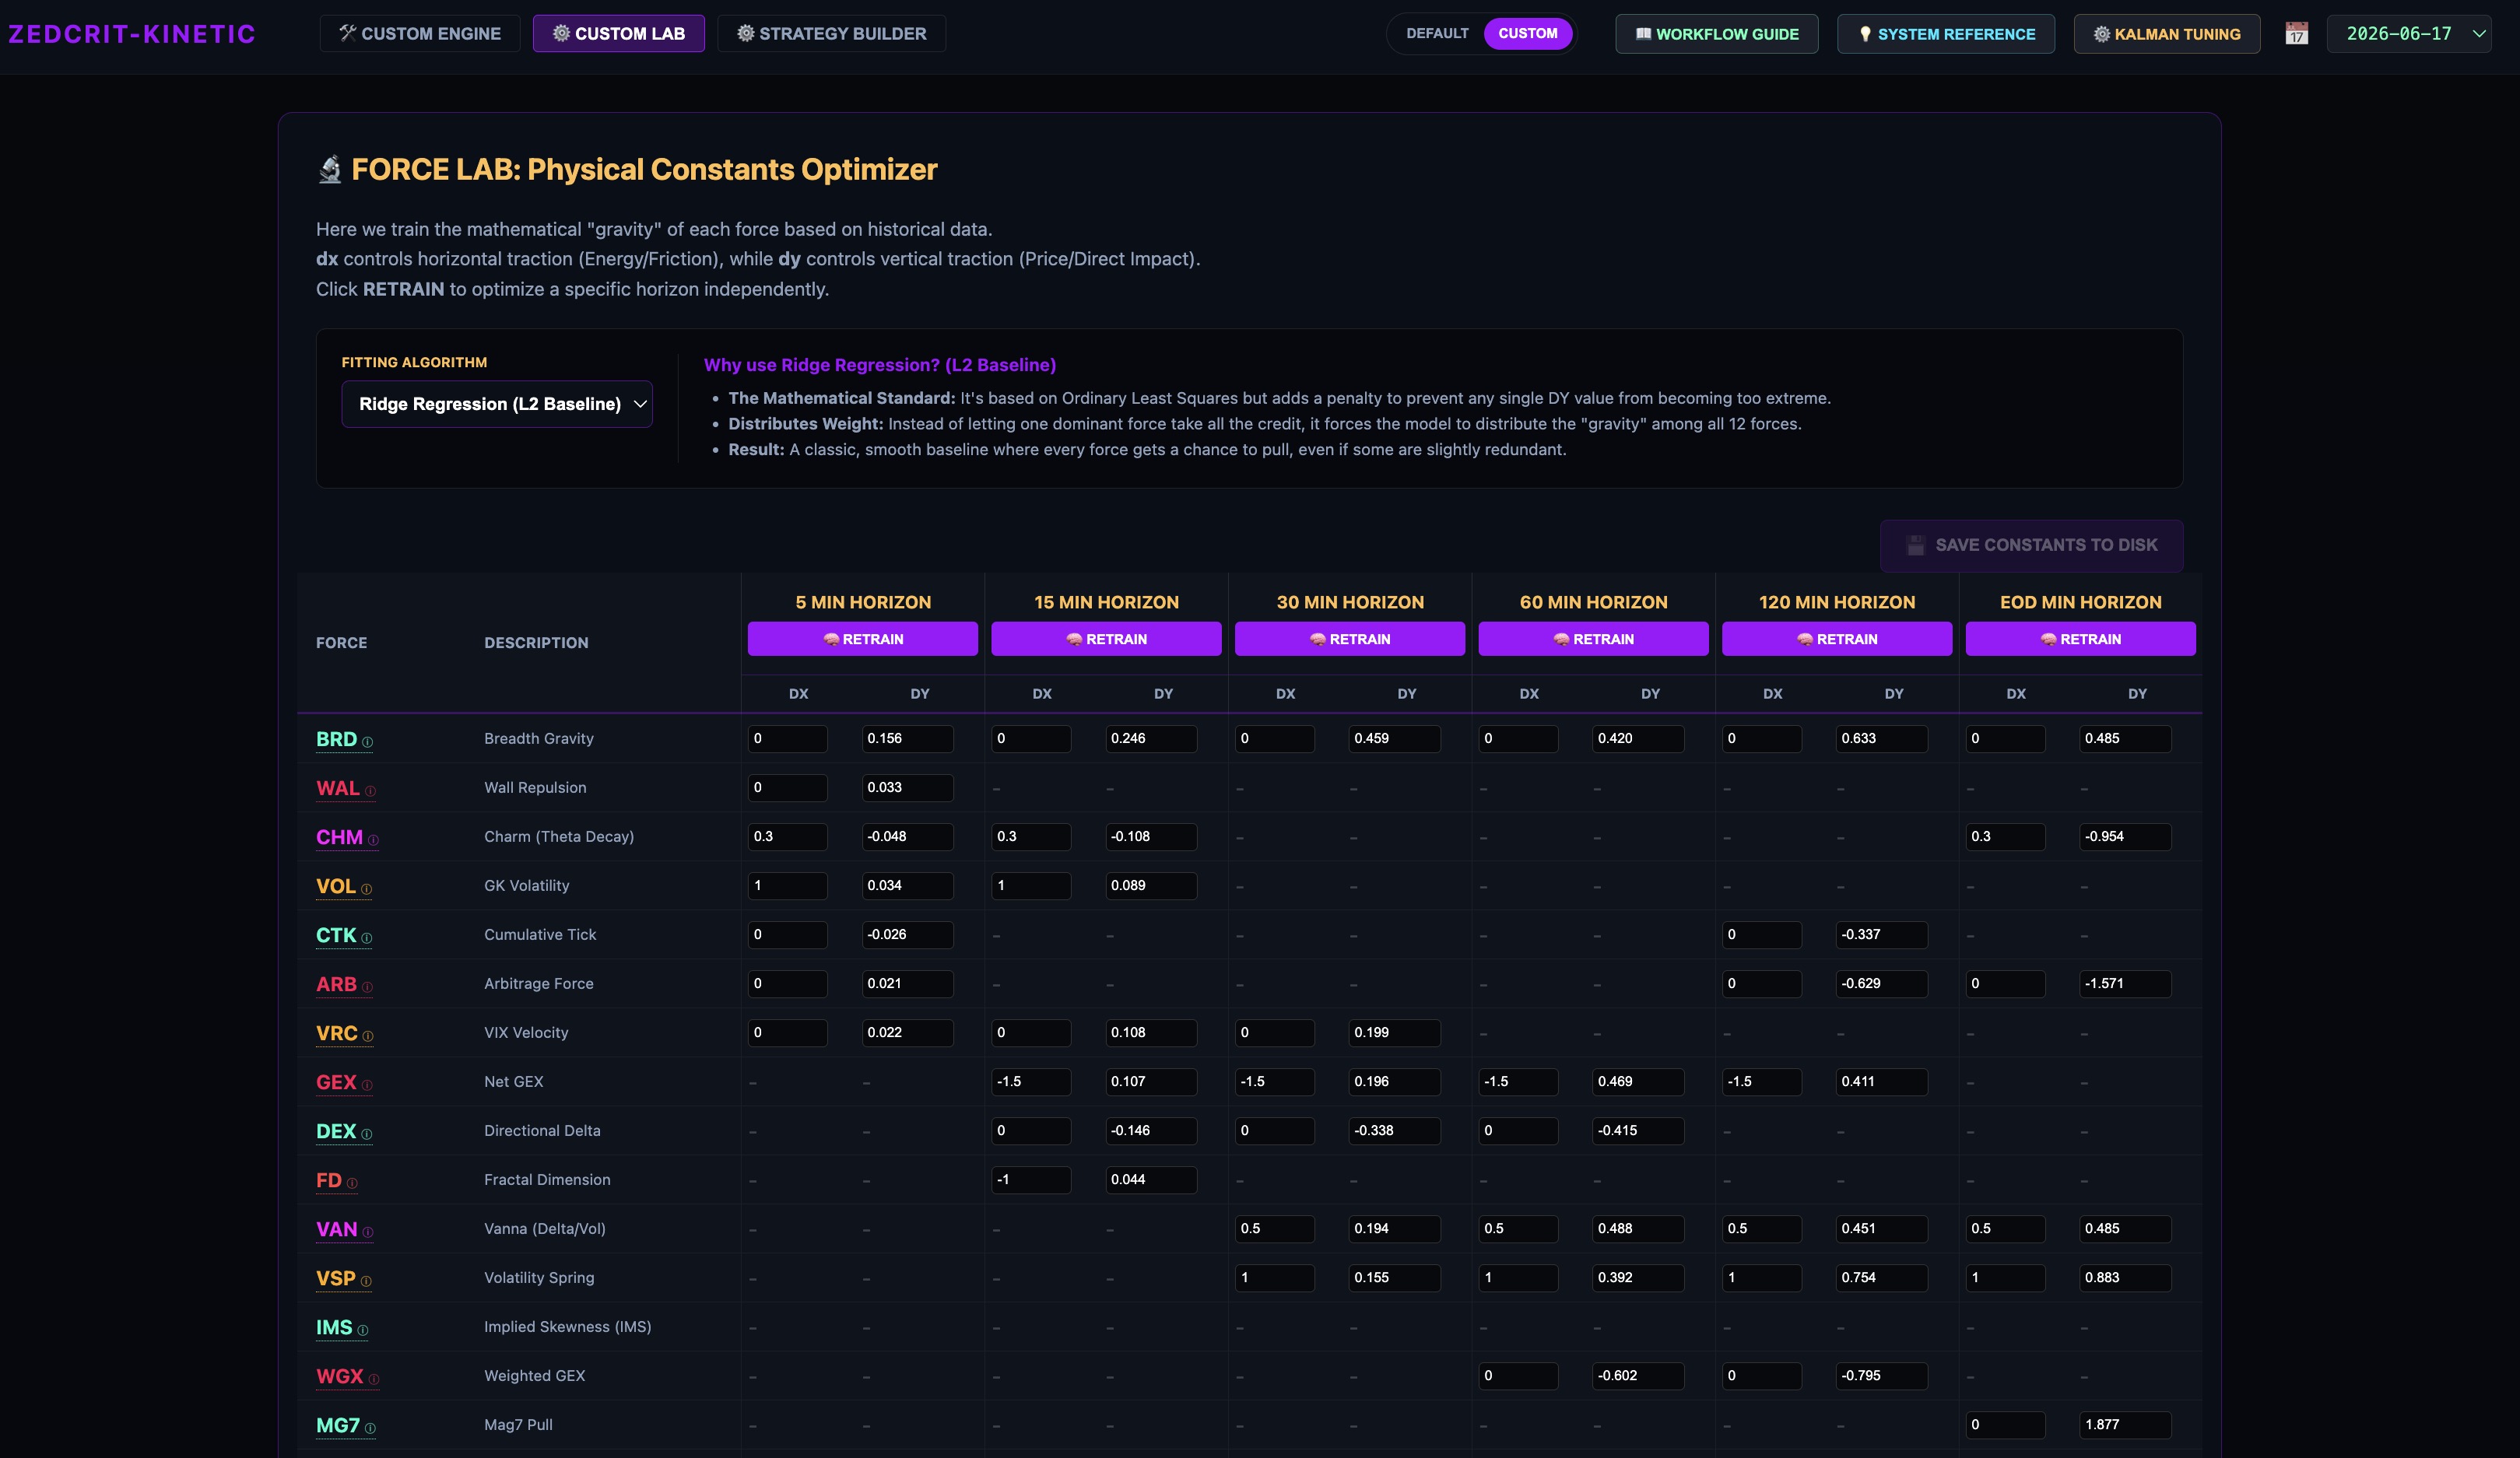
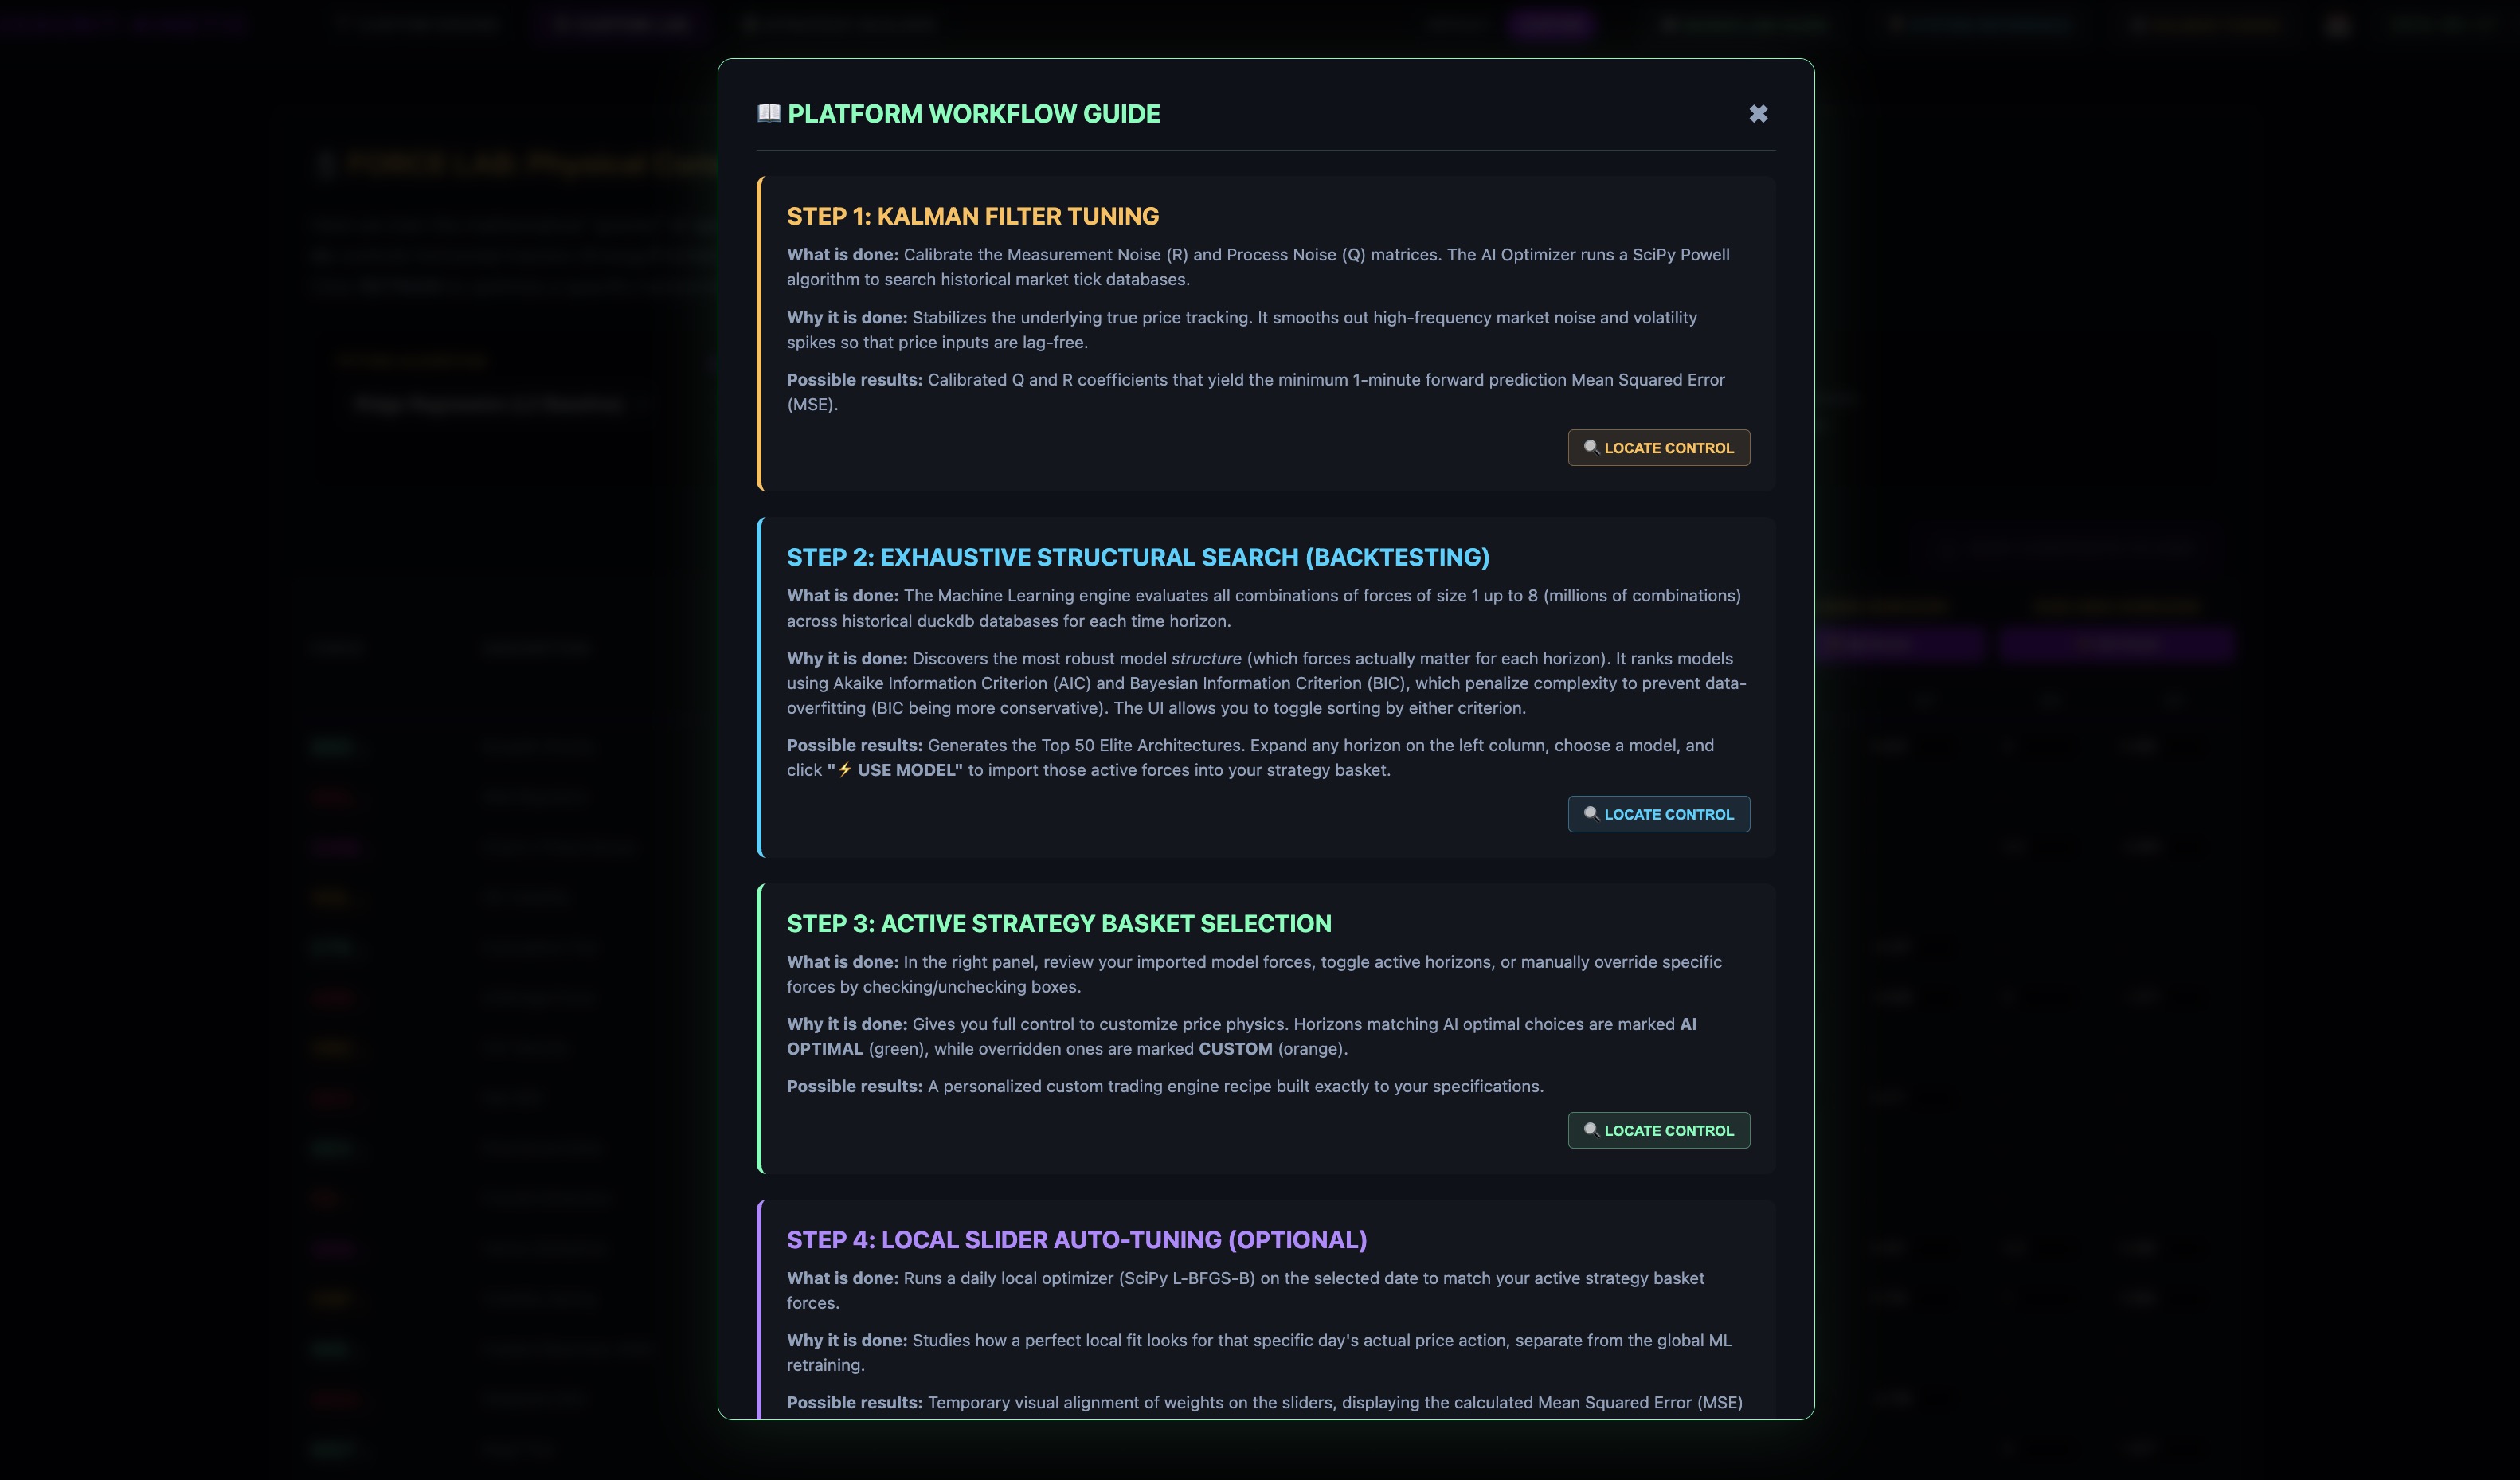
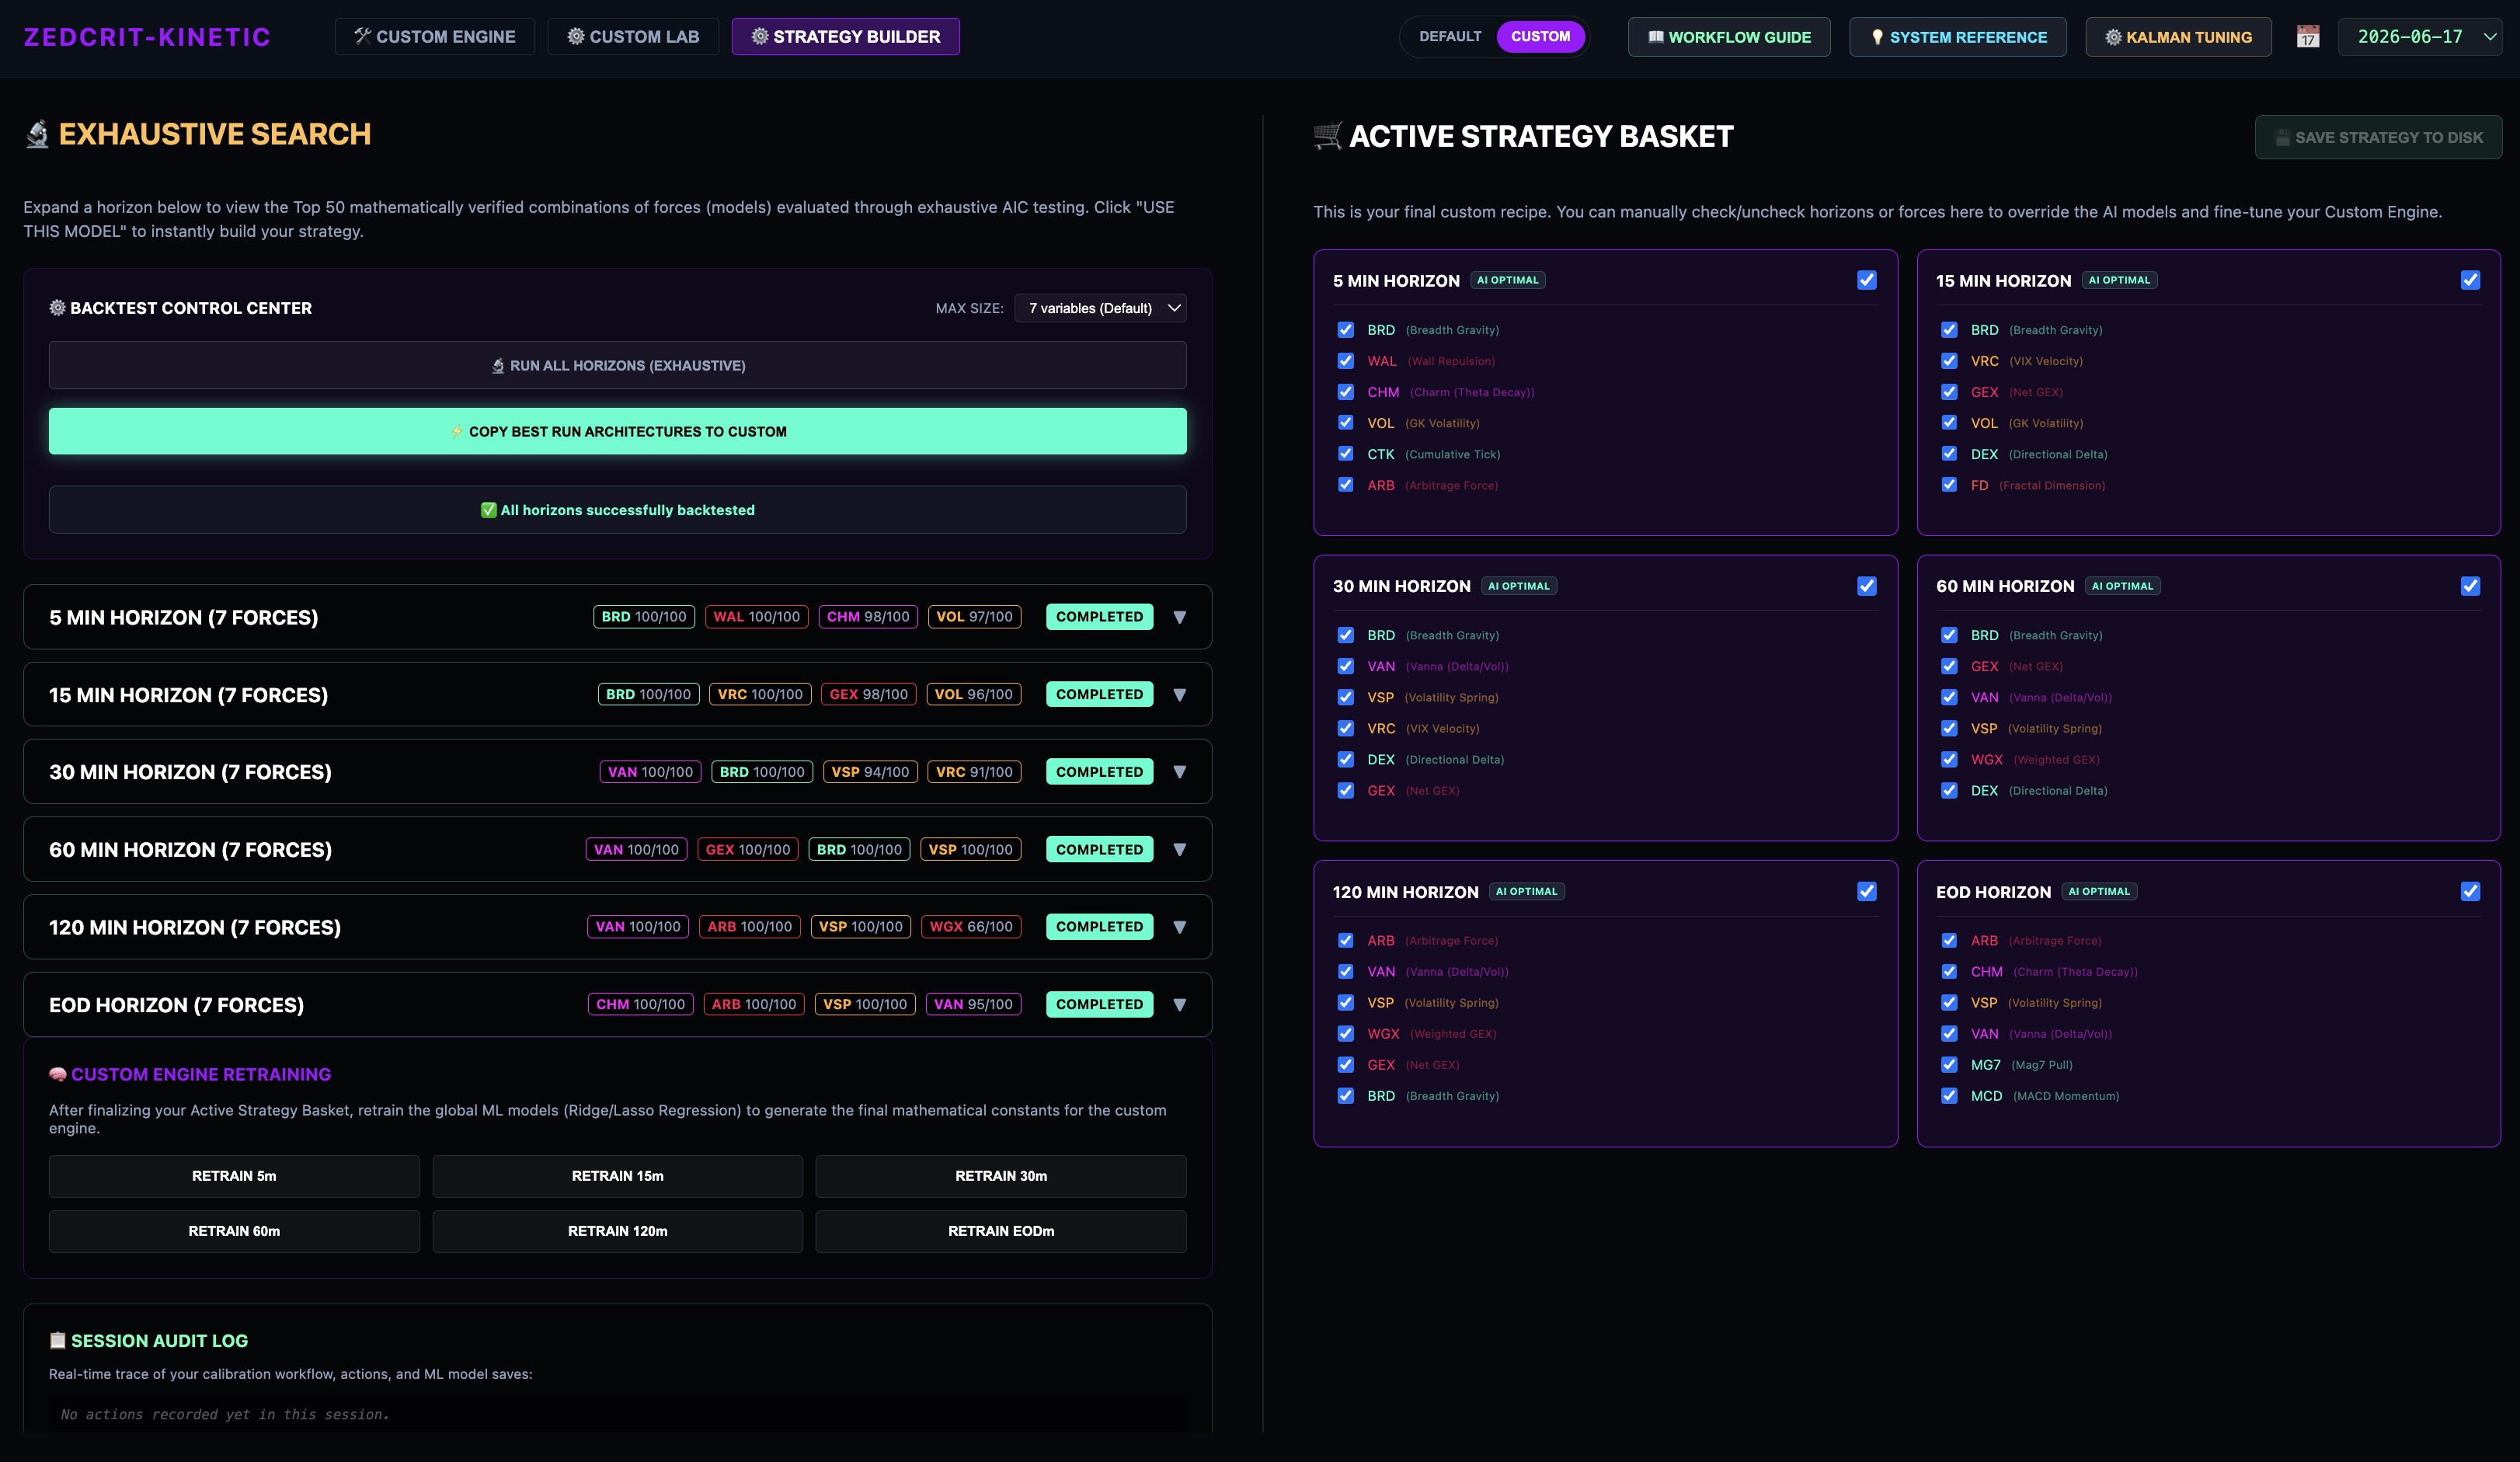
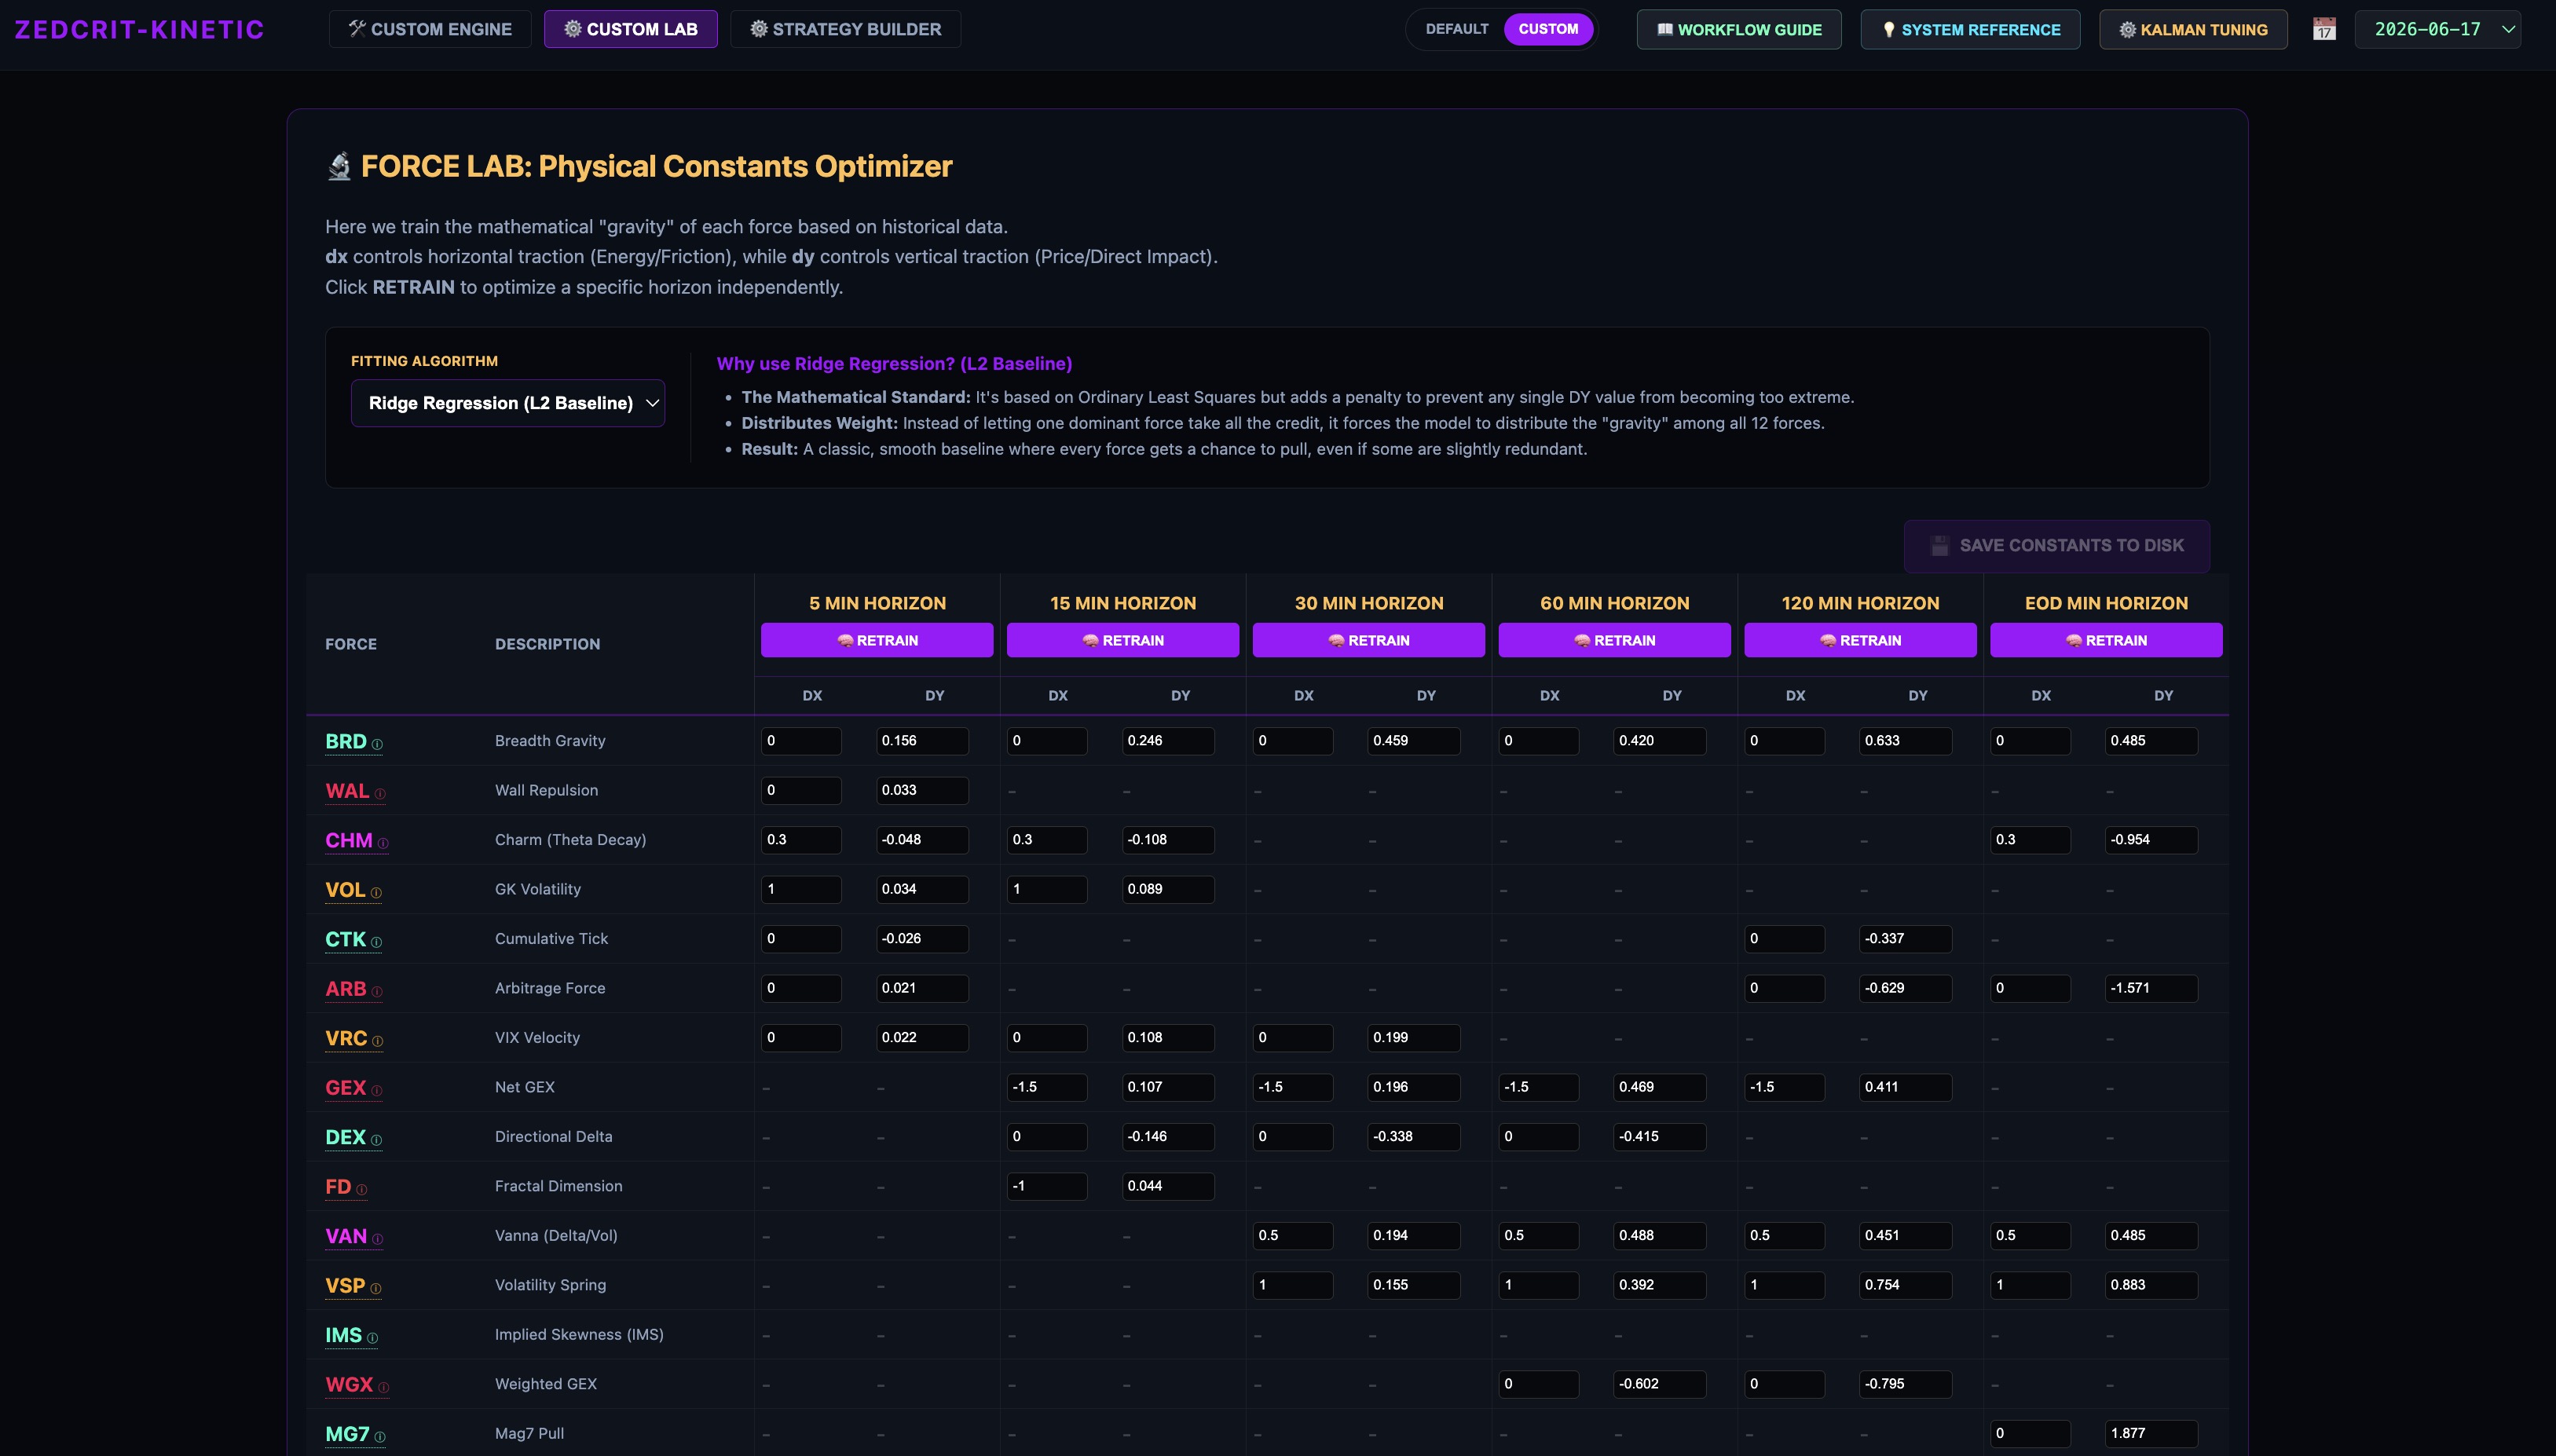
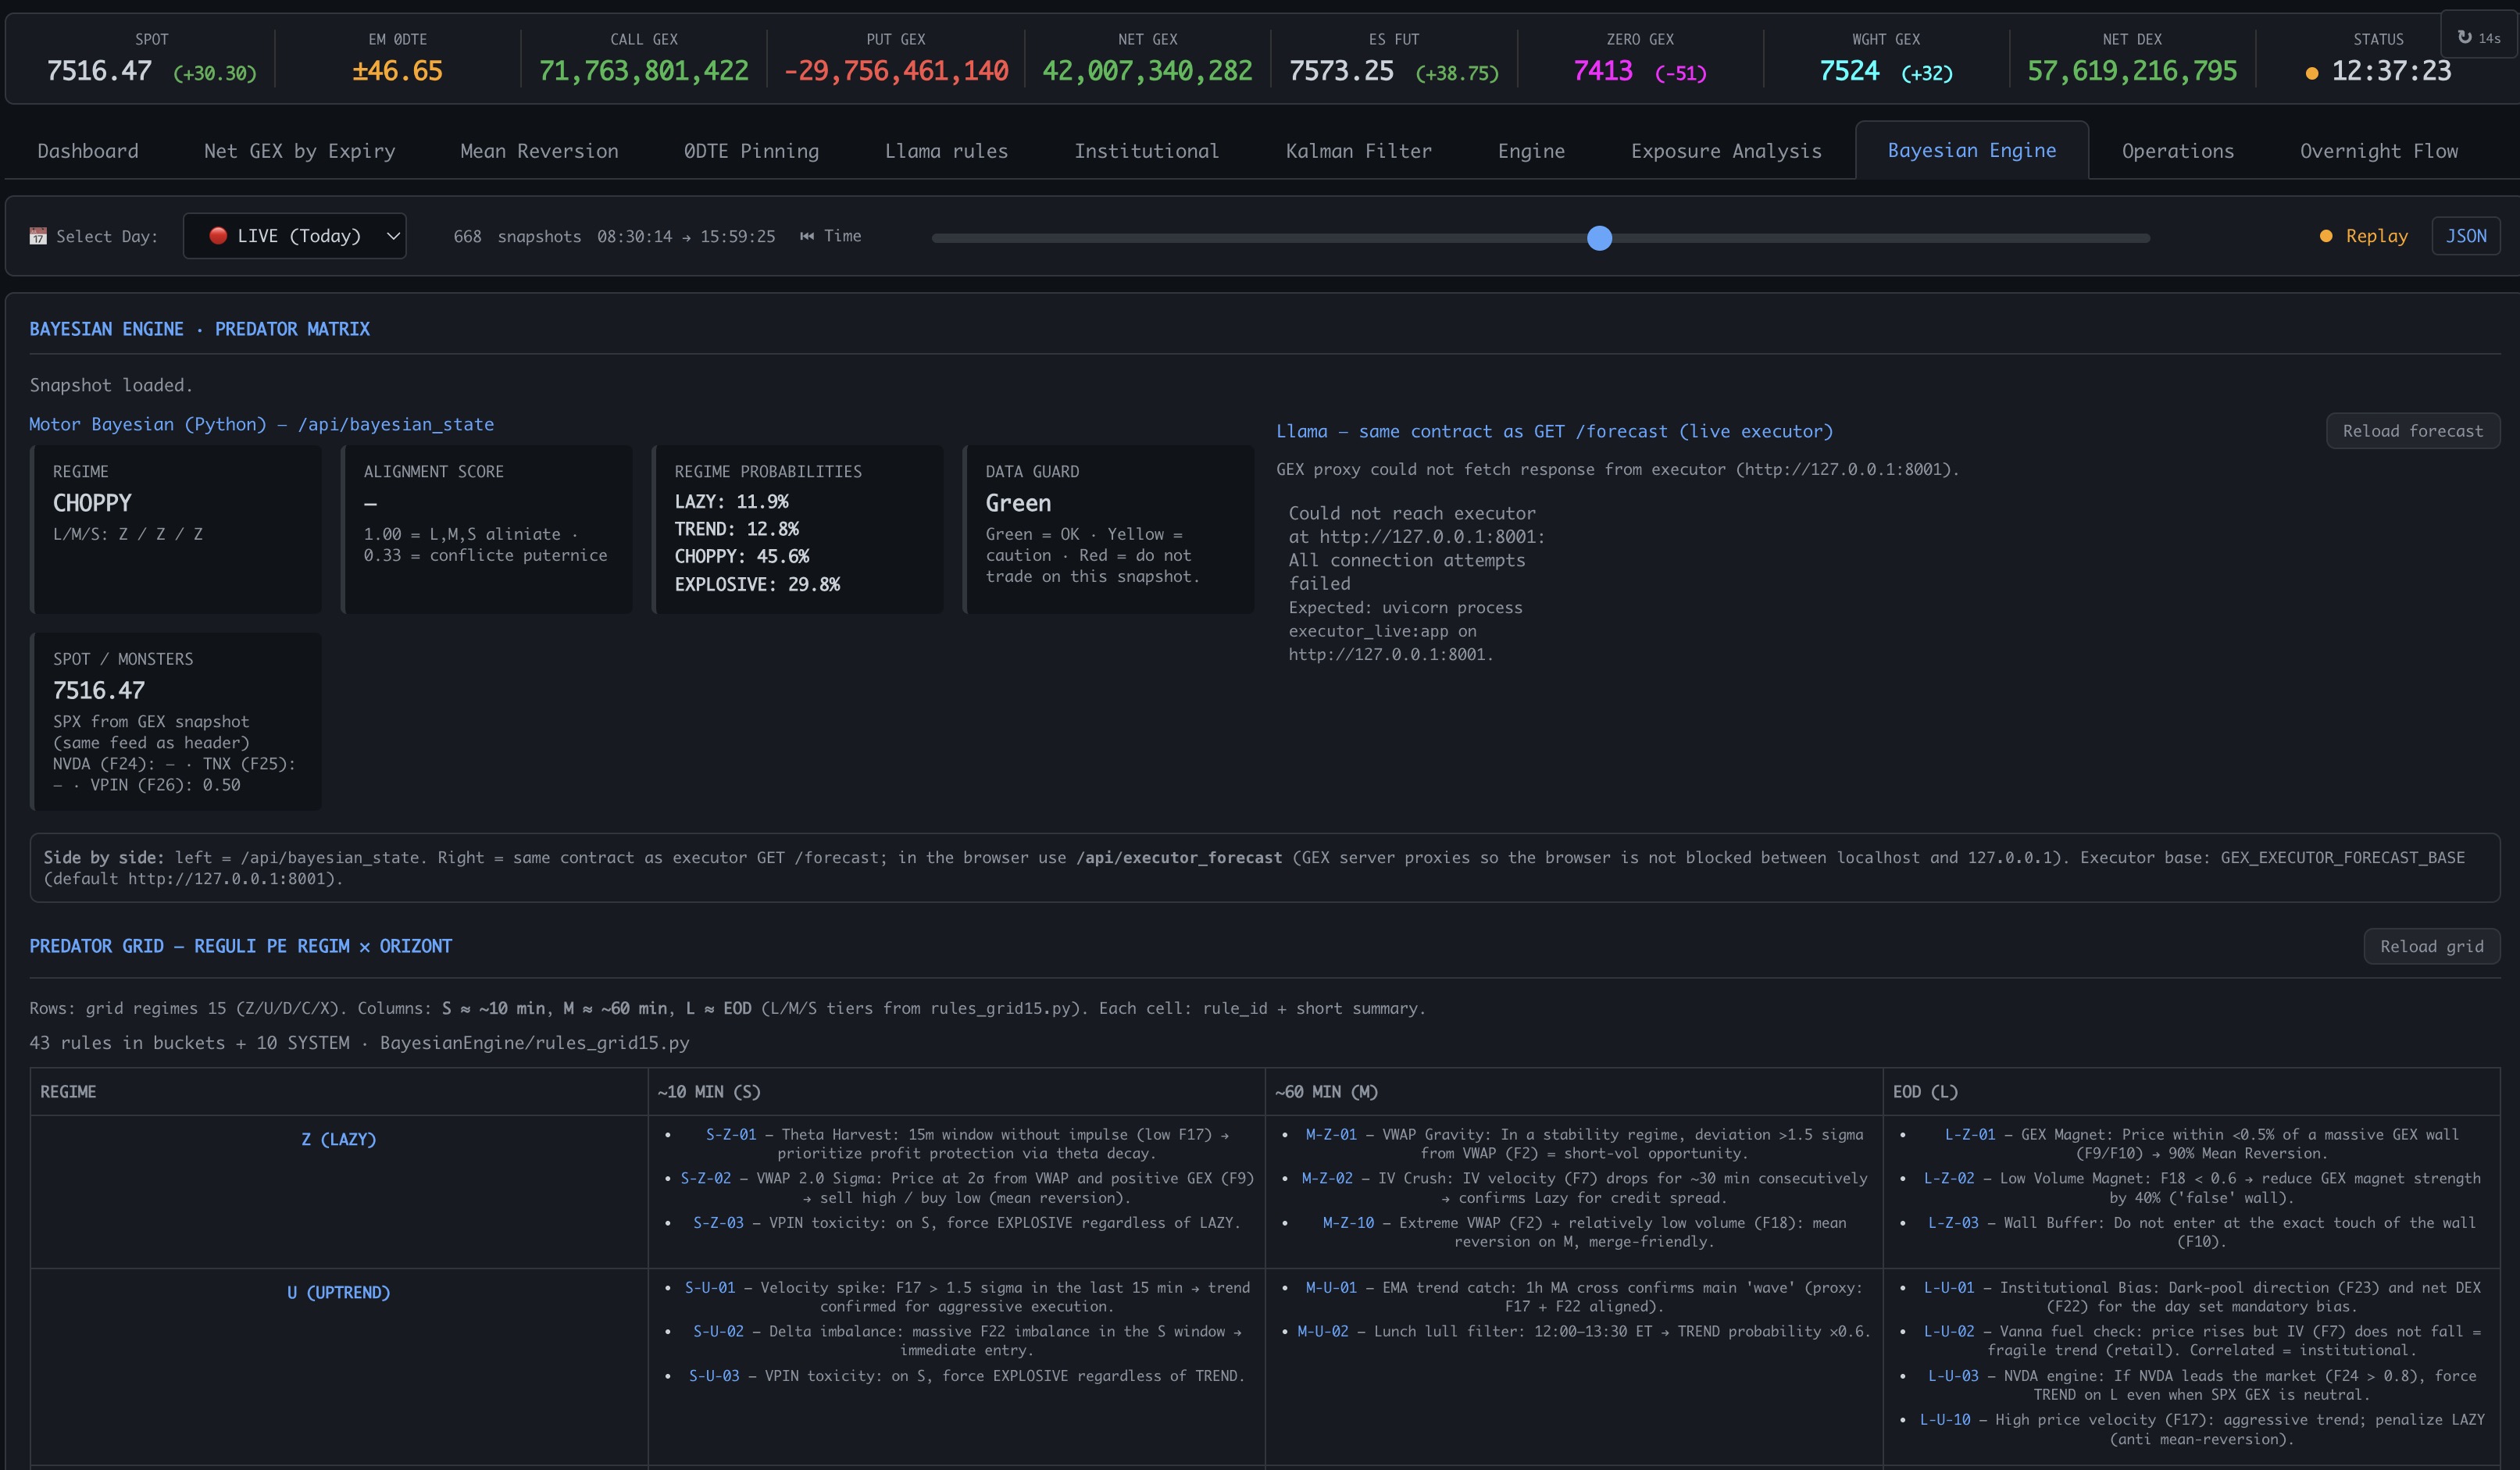
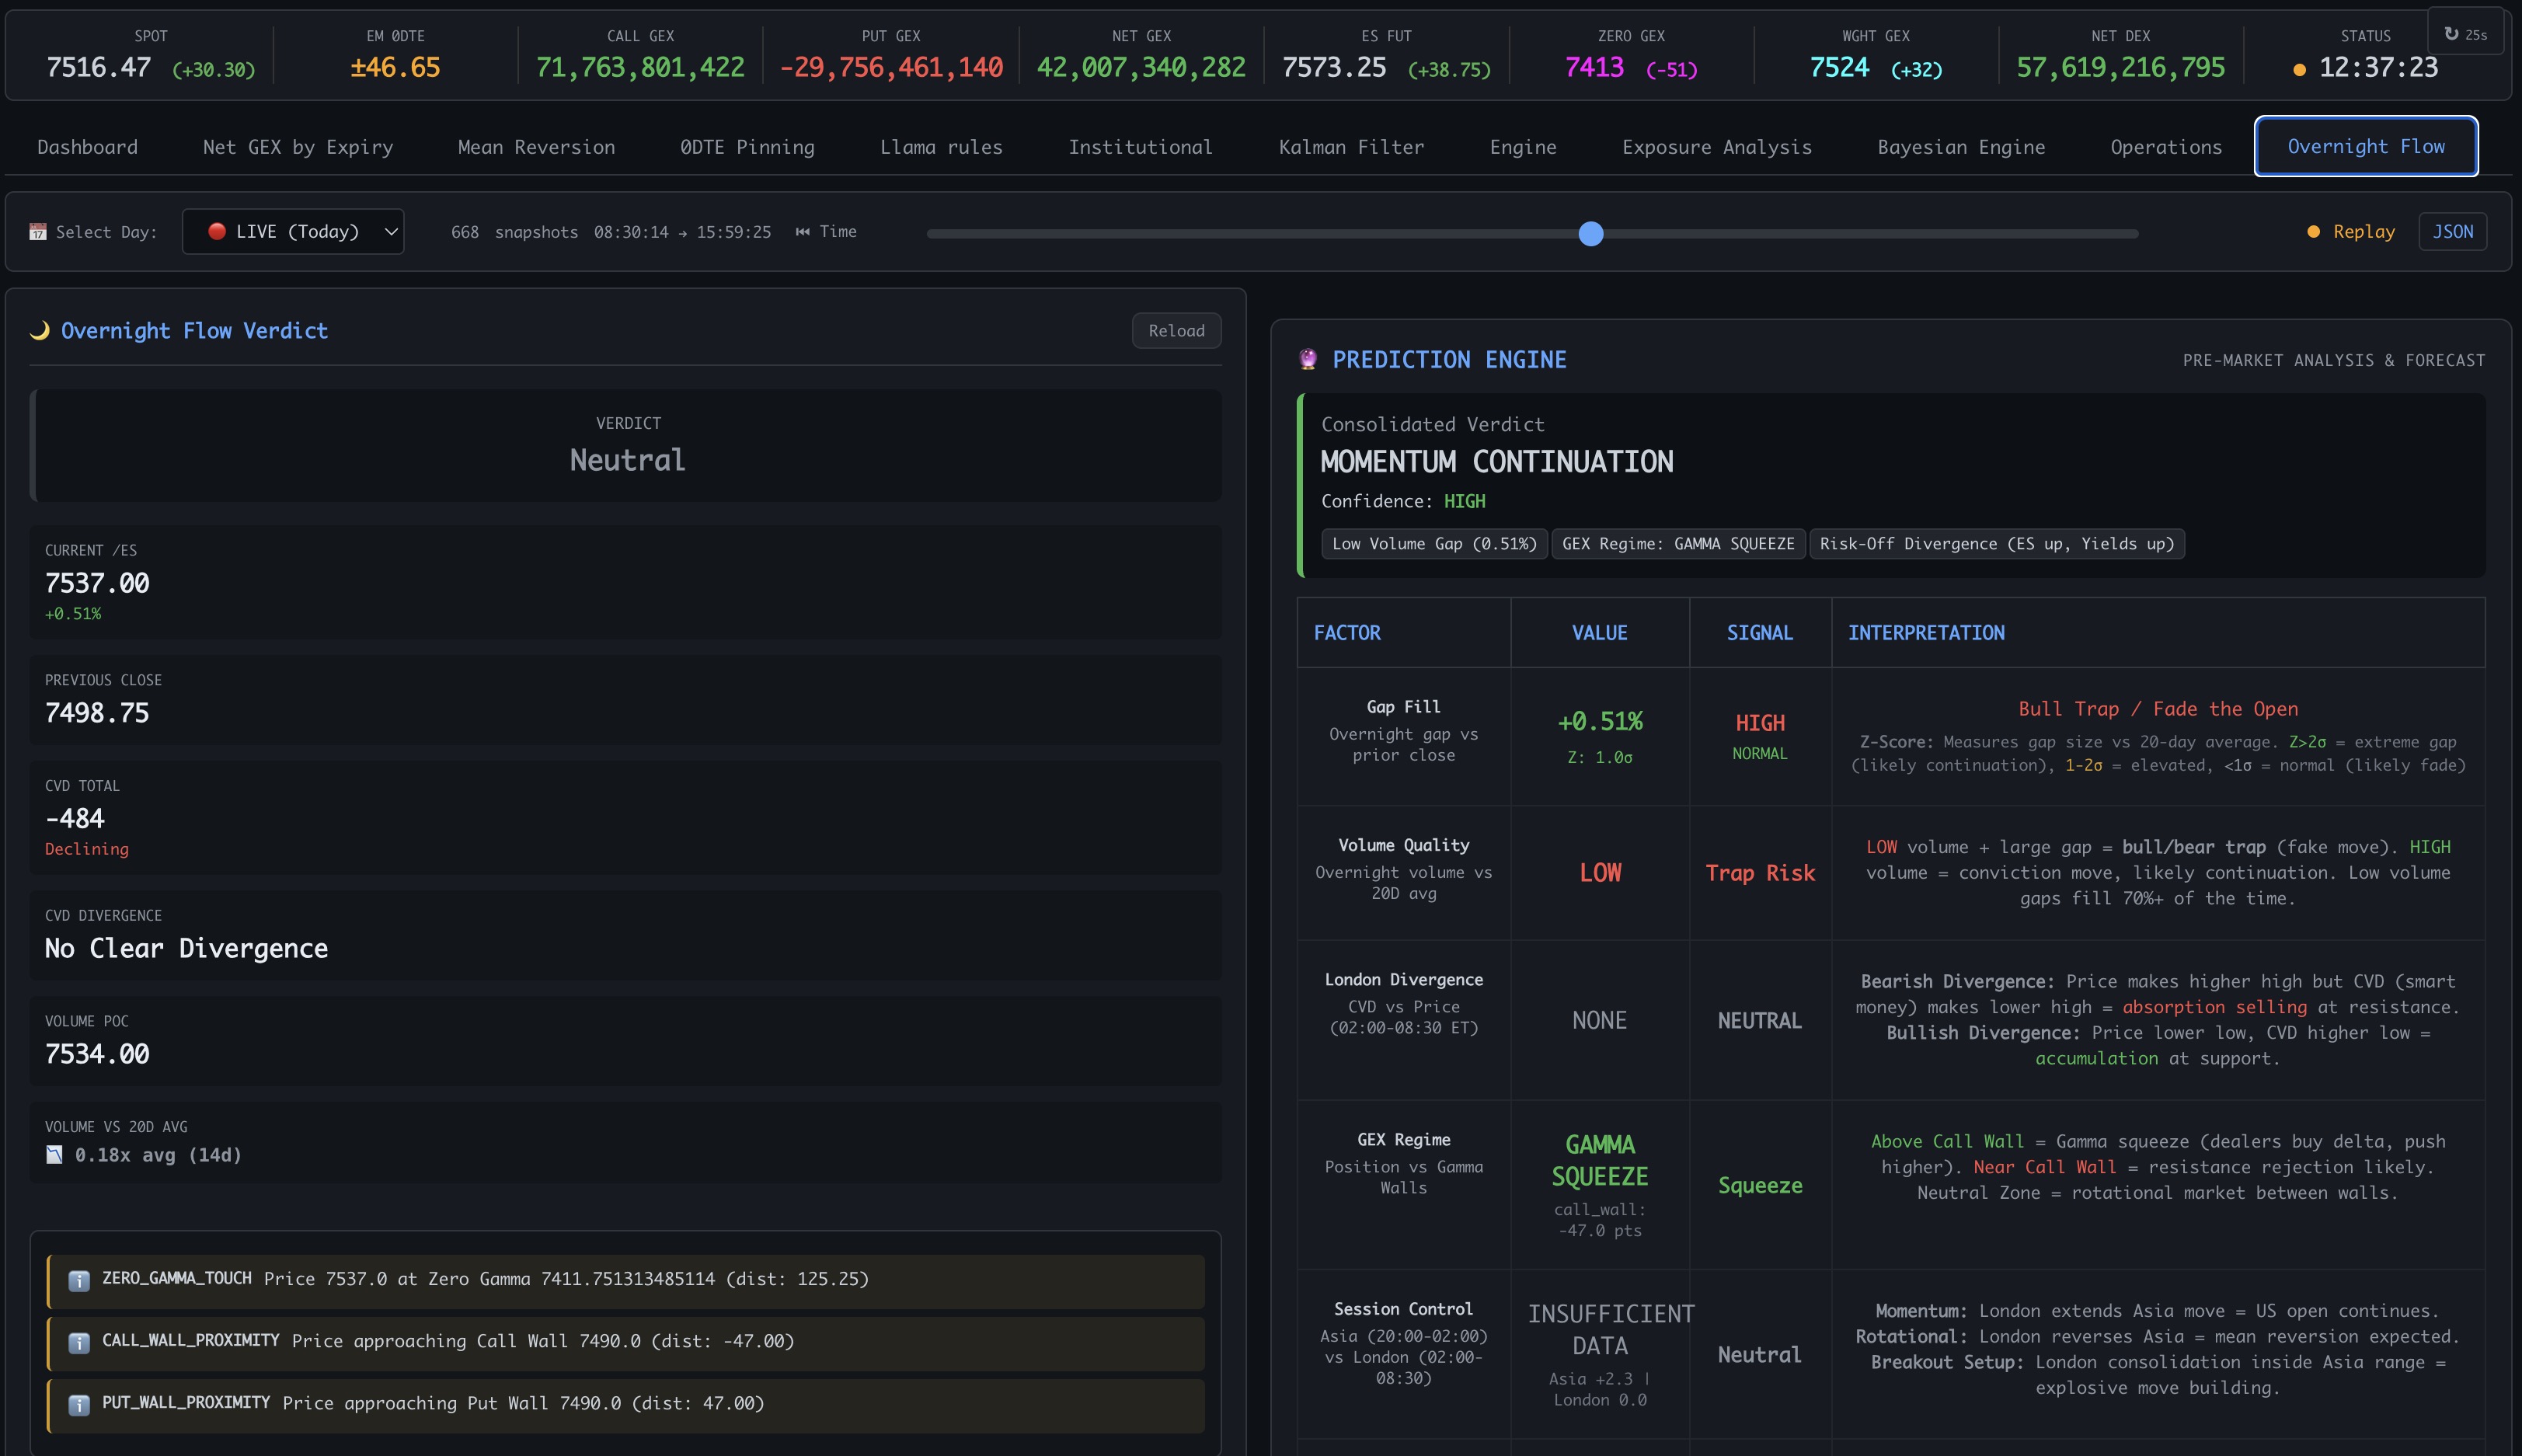
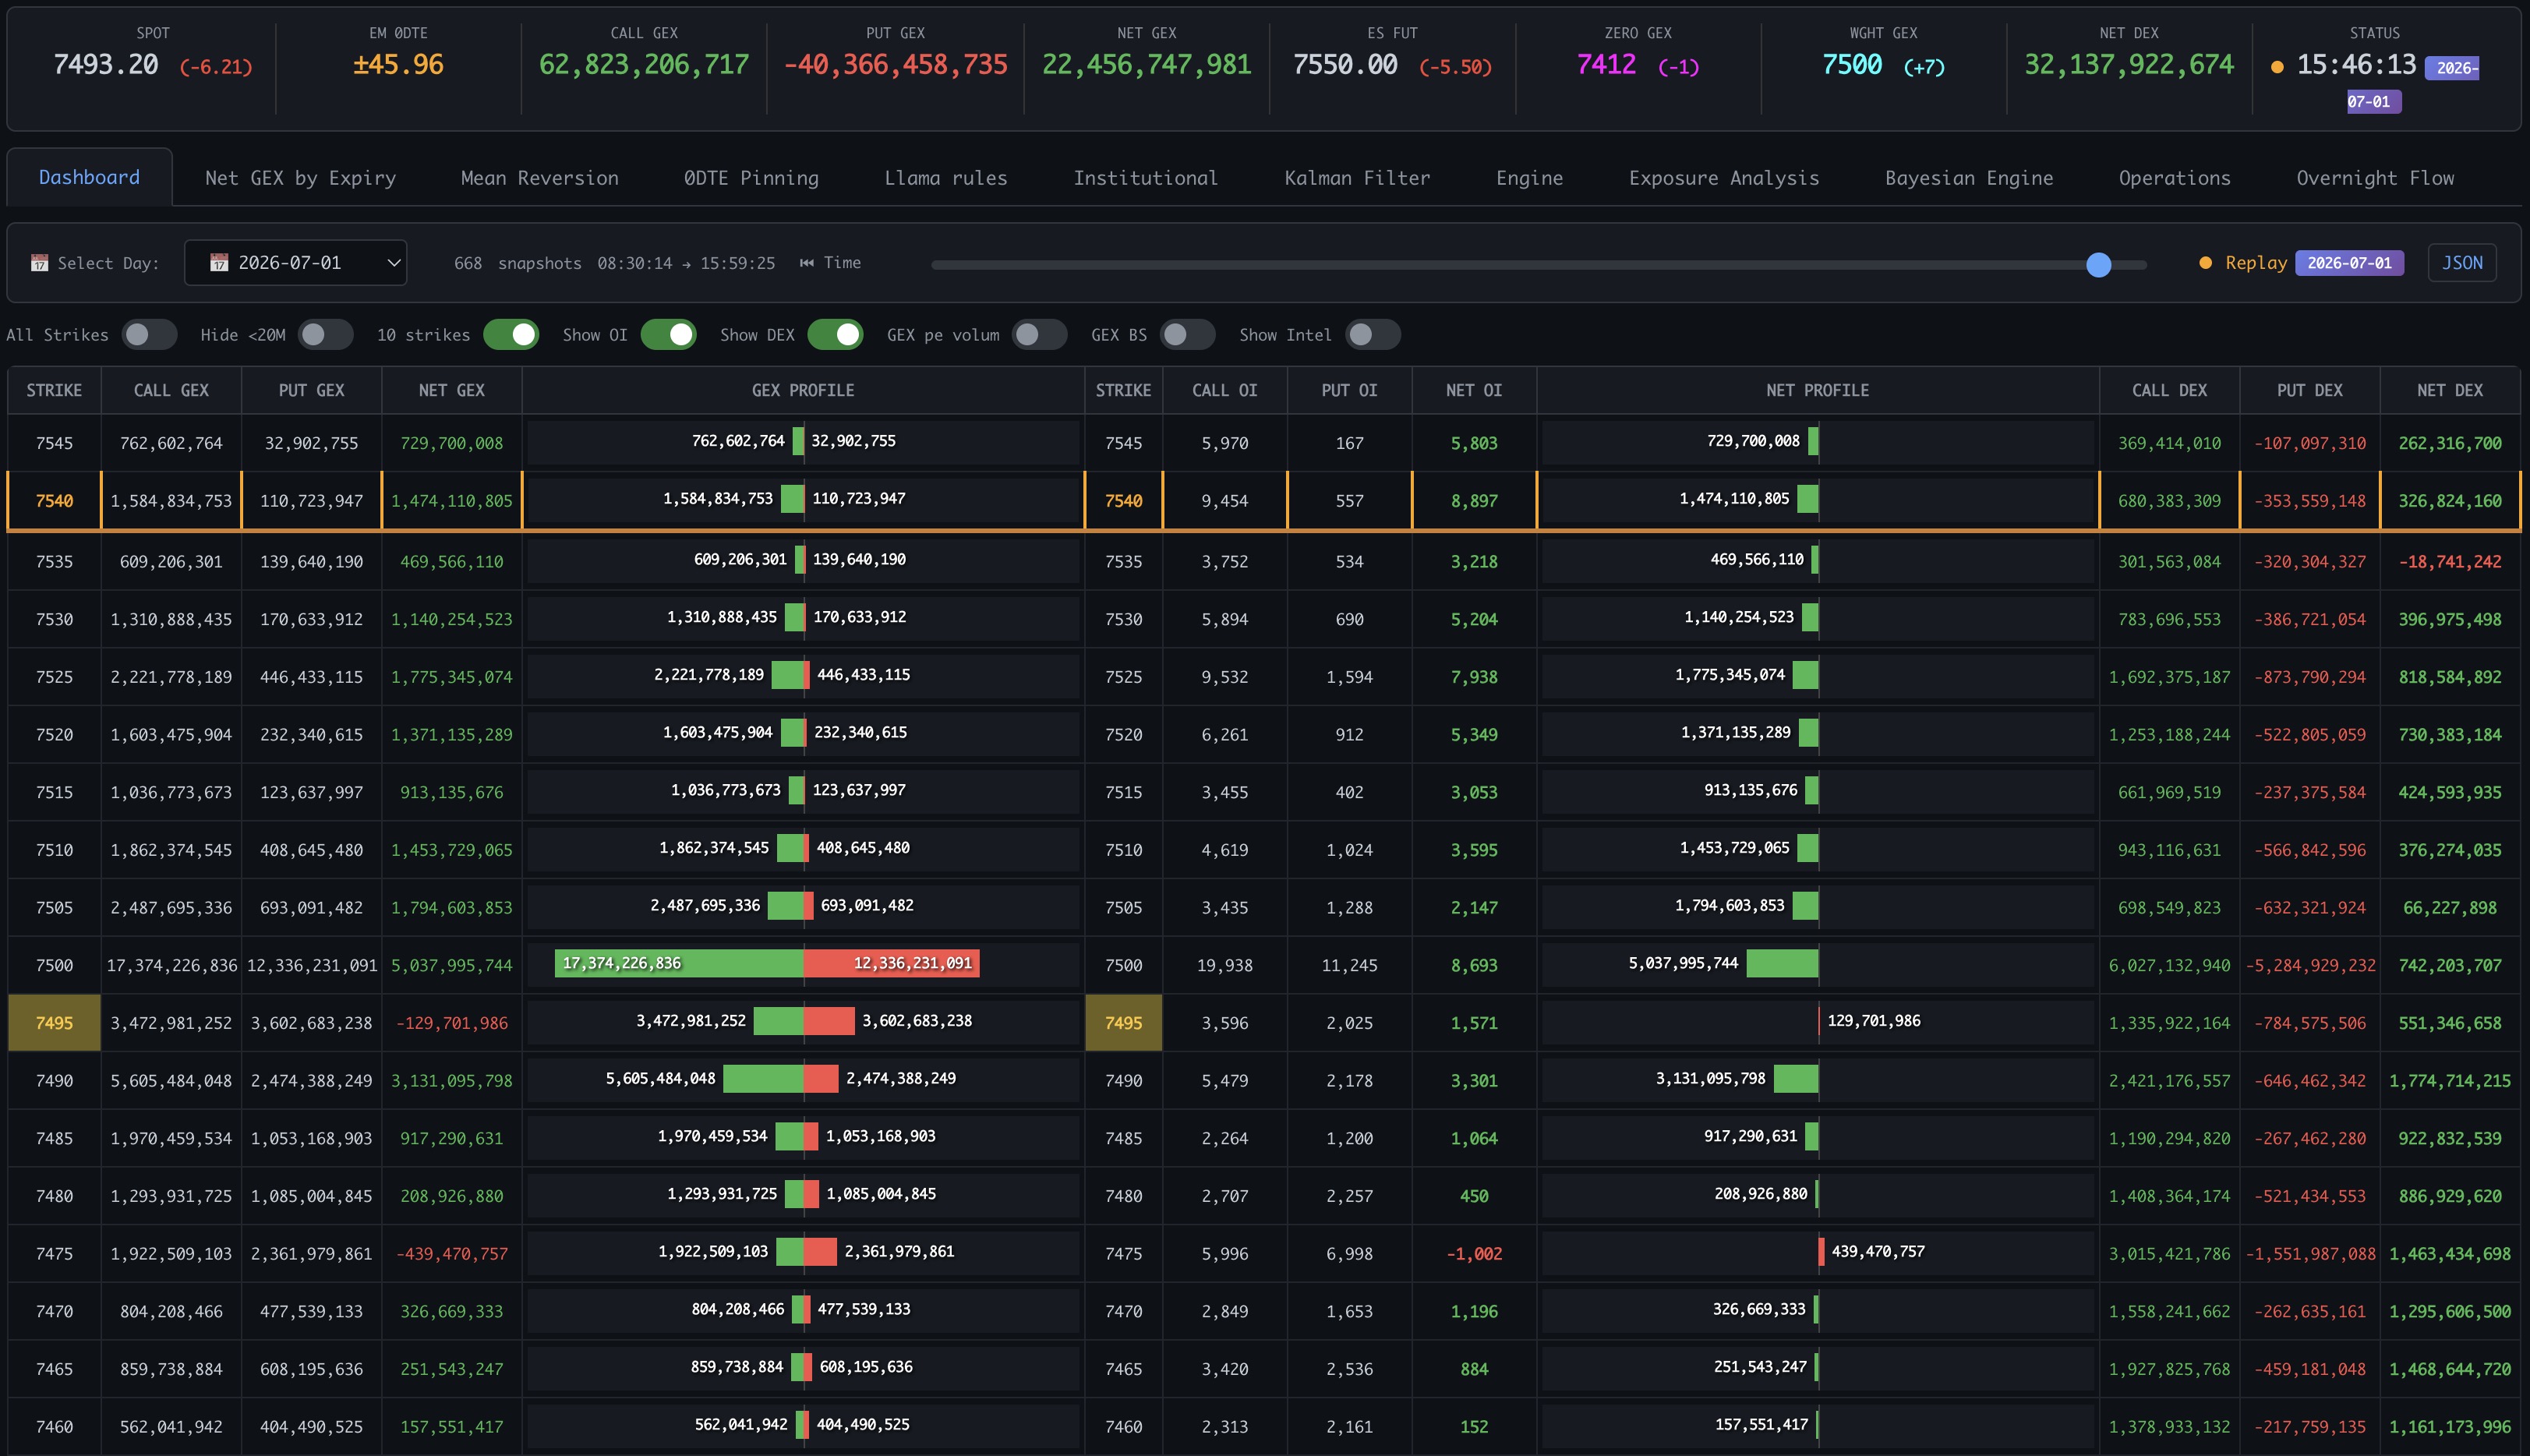
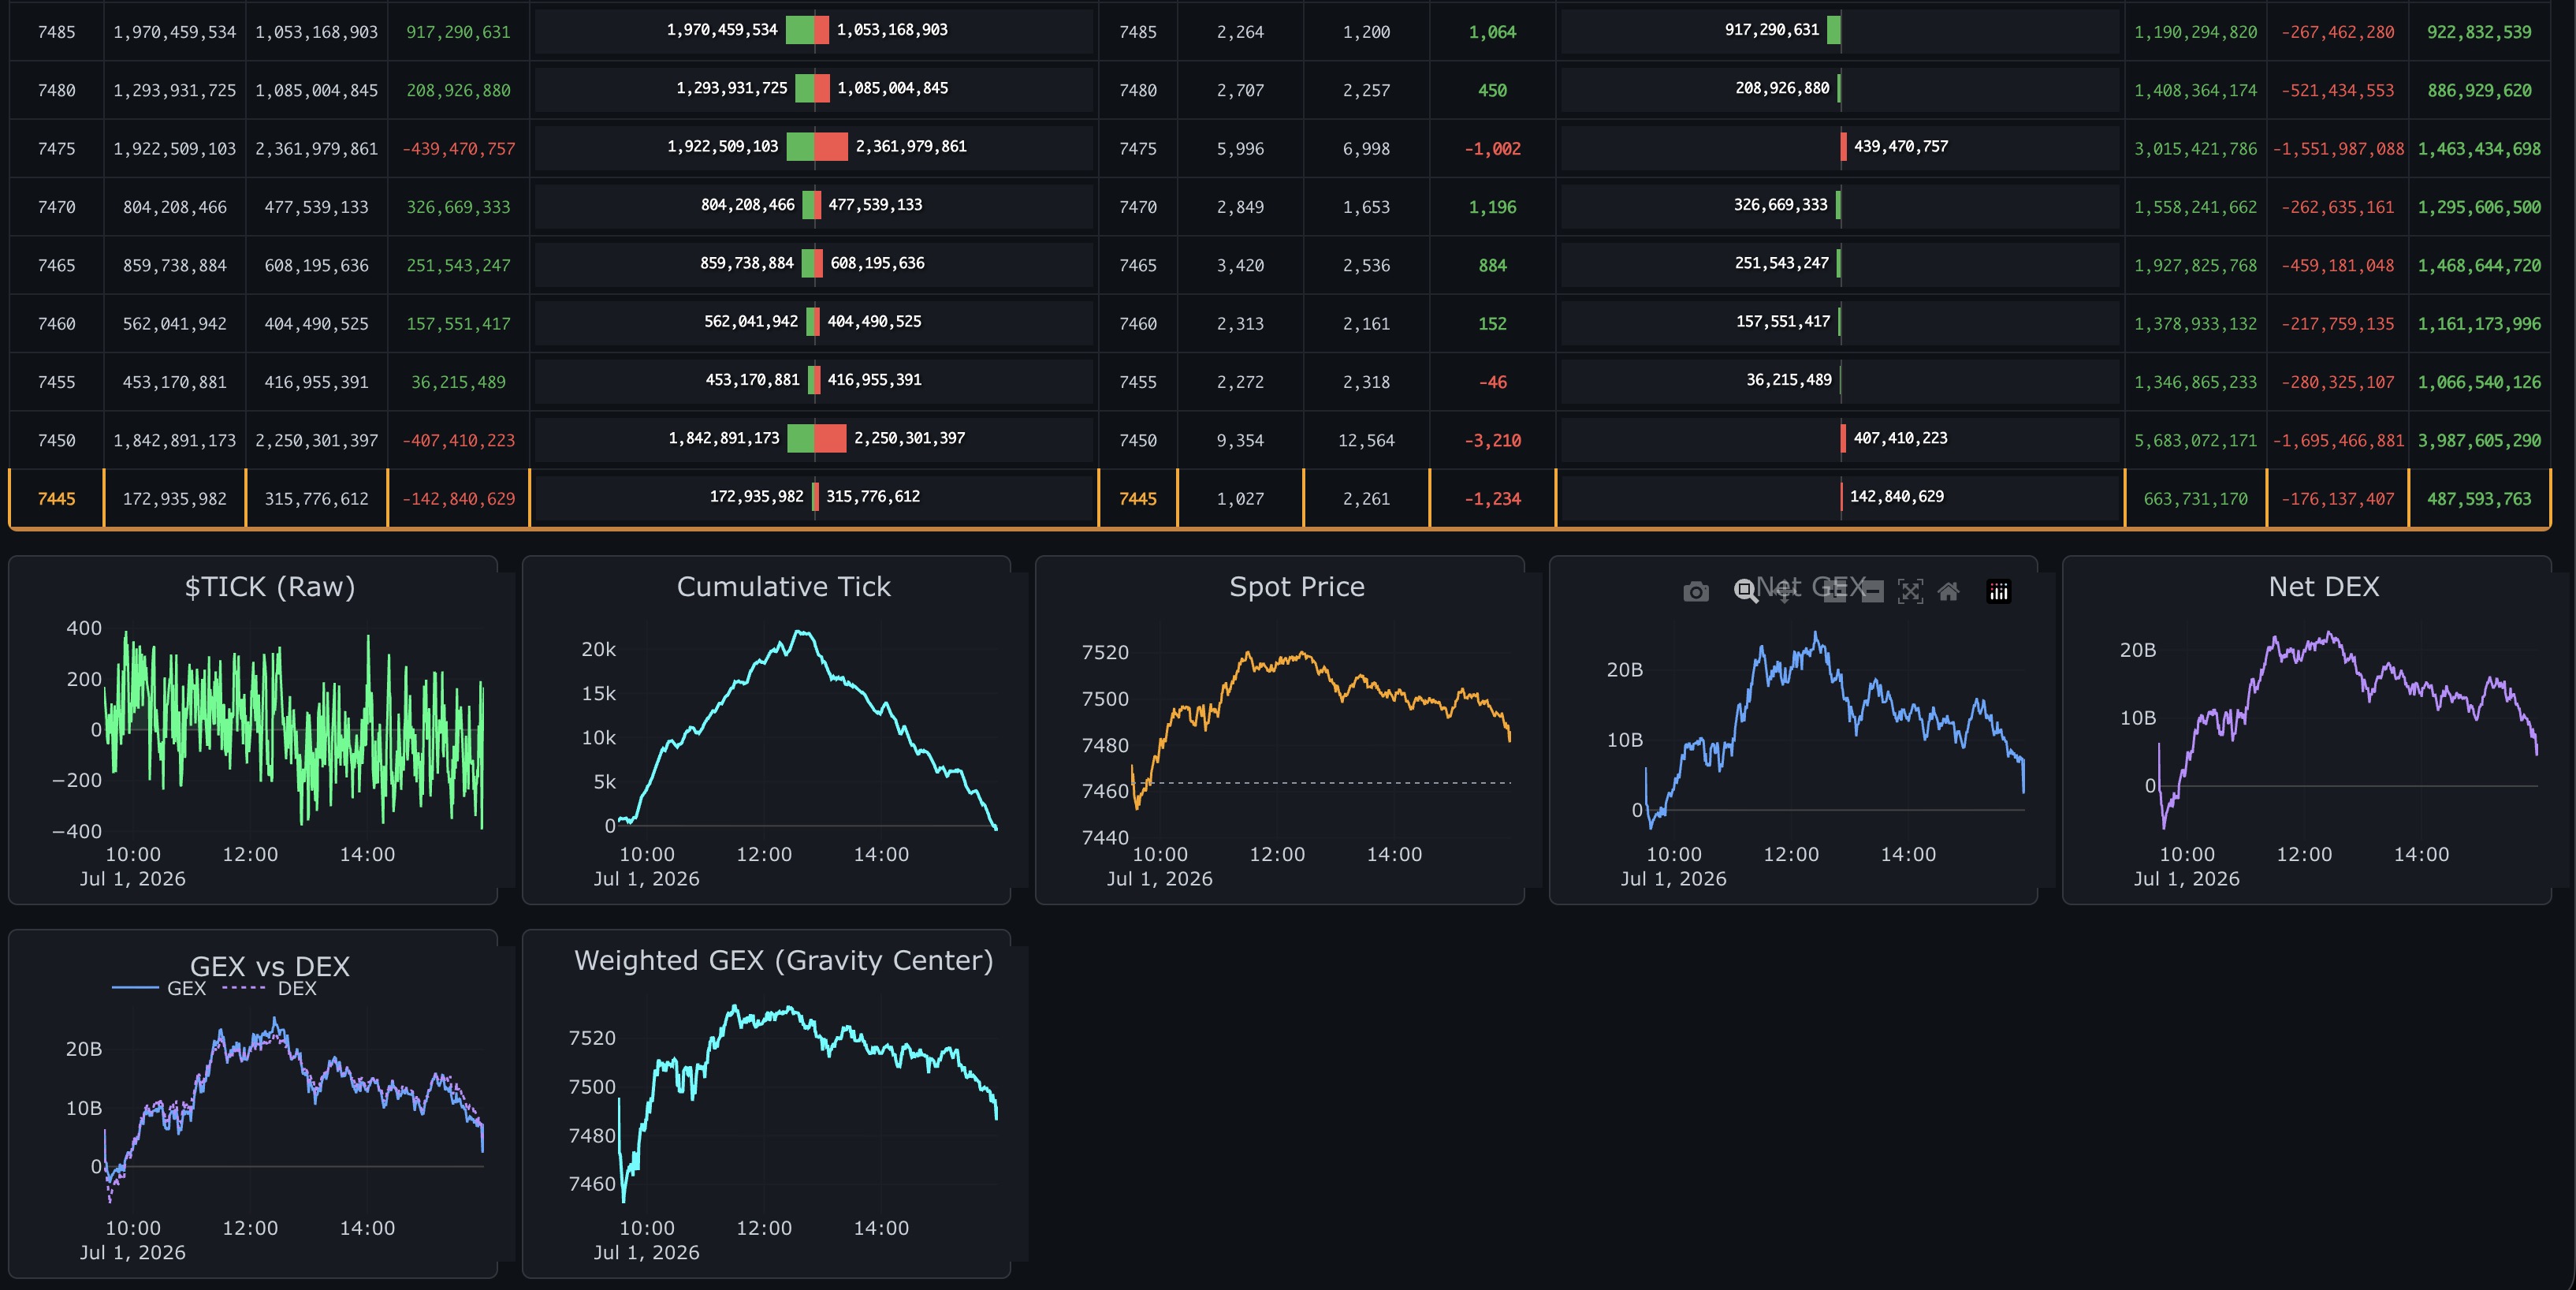
No results found
Try different keywords or clear the search.
Executive Overview
"I lost $25,000 in a single day. $15,000 on one account, $10,000 on another. I thought it was a choppy sideways day. I was wrong — the market had shifted into a strong downtrend. I averaged in. I held. The bounce never came."
— Adrian Danet, Founder & CEO
What I needed — but didn't have — was a system that could tell me in real time: the regime has shifted. This is no longer sideways. This is a downtrend. Exit now.
After that day I studied everything: Hidden Markov Models, Kalman filters, GEX analytics, market microstructure. The tools existed, but were scattered across expensive platforms, requiring PhD-level coding, and impossible to access in real time.
So I built my own. Zedcrit Terminal is the system I wish I had that day. It's the difference between gambling and making a statistically calculated decision. Adrian Oprisor joined as CTO, refined the engineering, and together we now have a highly functional prototype.
Investor Takeaway
The Problem in 1 Sentence
Active options traders lose thousands of dollars because they cannot identify market regimes in real time — and every available solution is either too expensive, too generic, not private, or technically inaccessible.
The Solution in 1 Sentence
Zedcrit Terminal is a plug-and-play hardware appliance that runs HMM regime detection, complete GEX analytics, and synthesized market forces locally on your desk — with $0/month data cost, using your existing Schwab account. Available in two configurations: Zedcrit Core ($799) and the premium Zedcrit Pro ($1,499).
| Capability | What It Does |
| HMM Regime Detection | Classifies market regime in real time: uptrend, downtrend, sideways, high volatility |
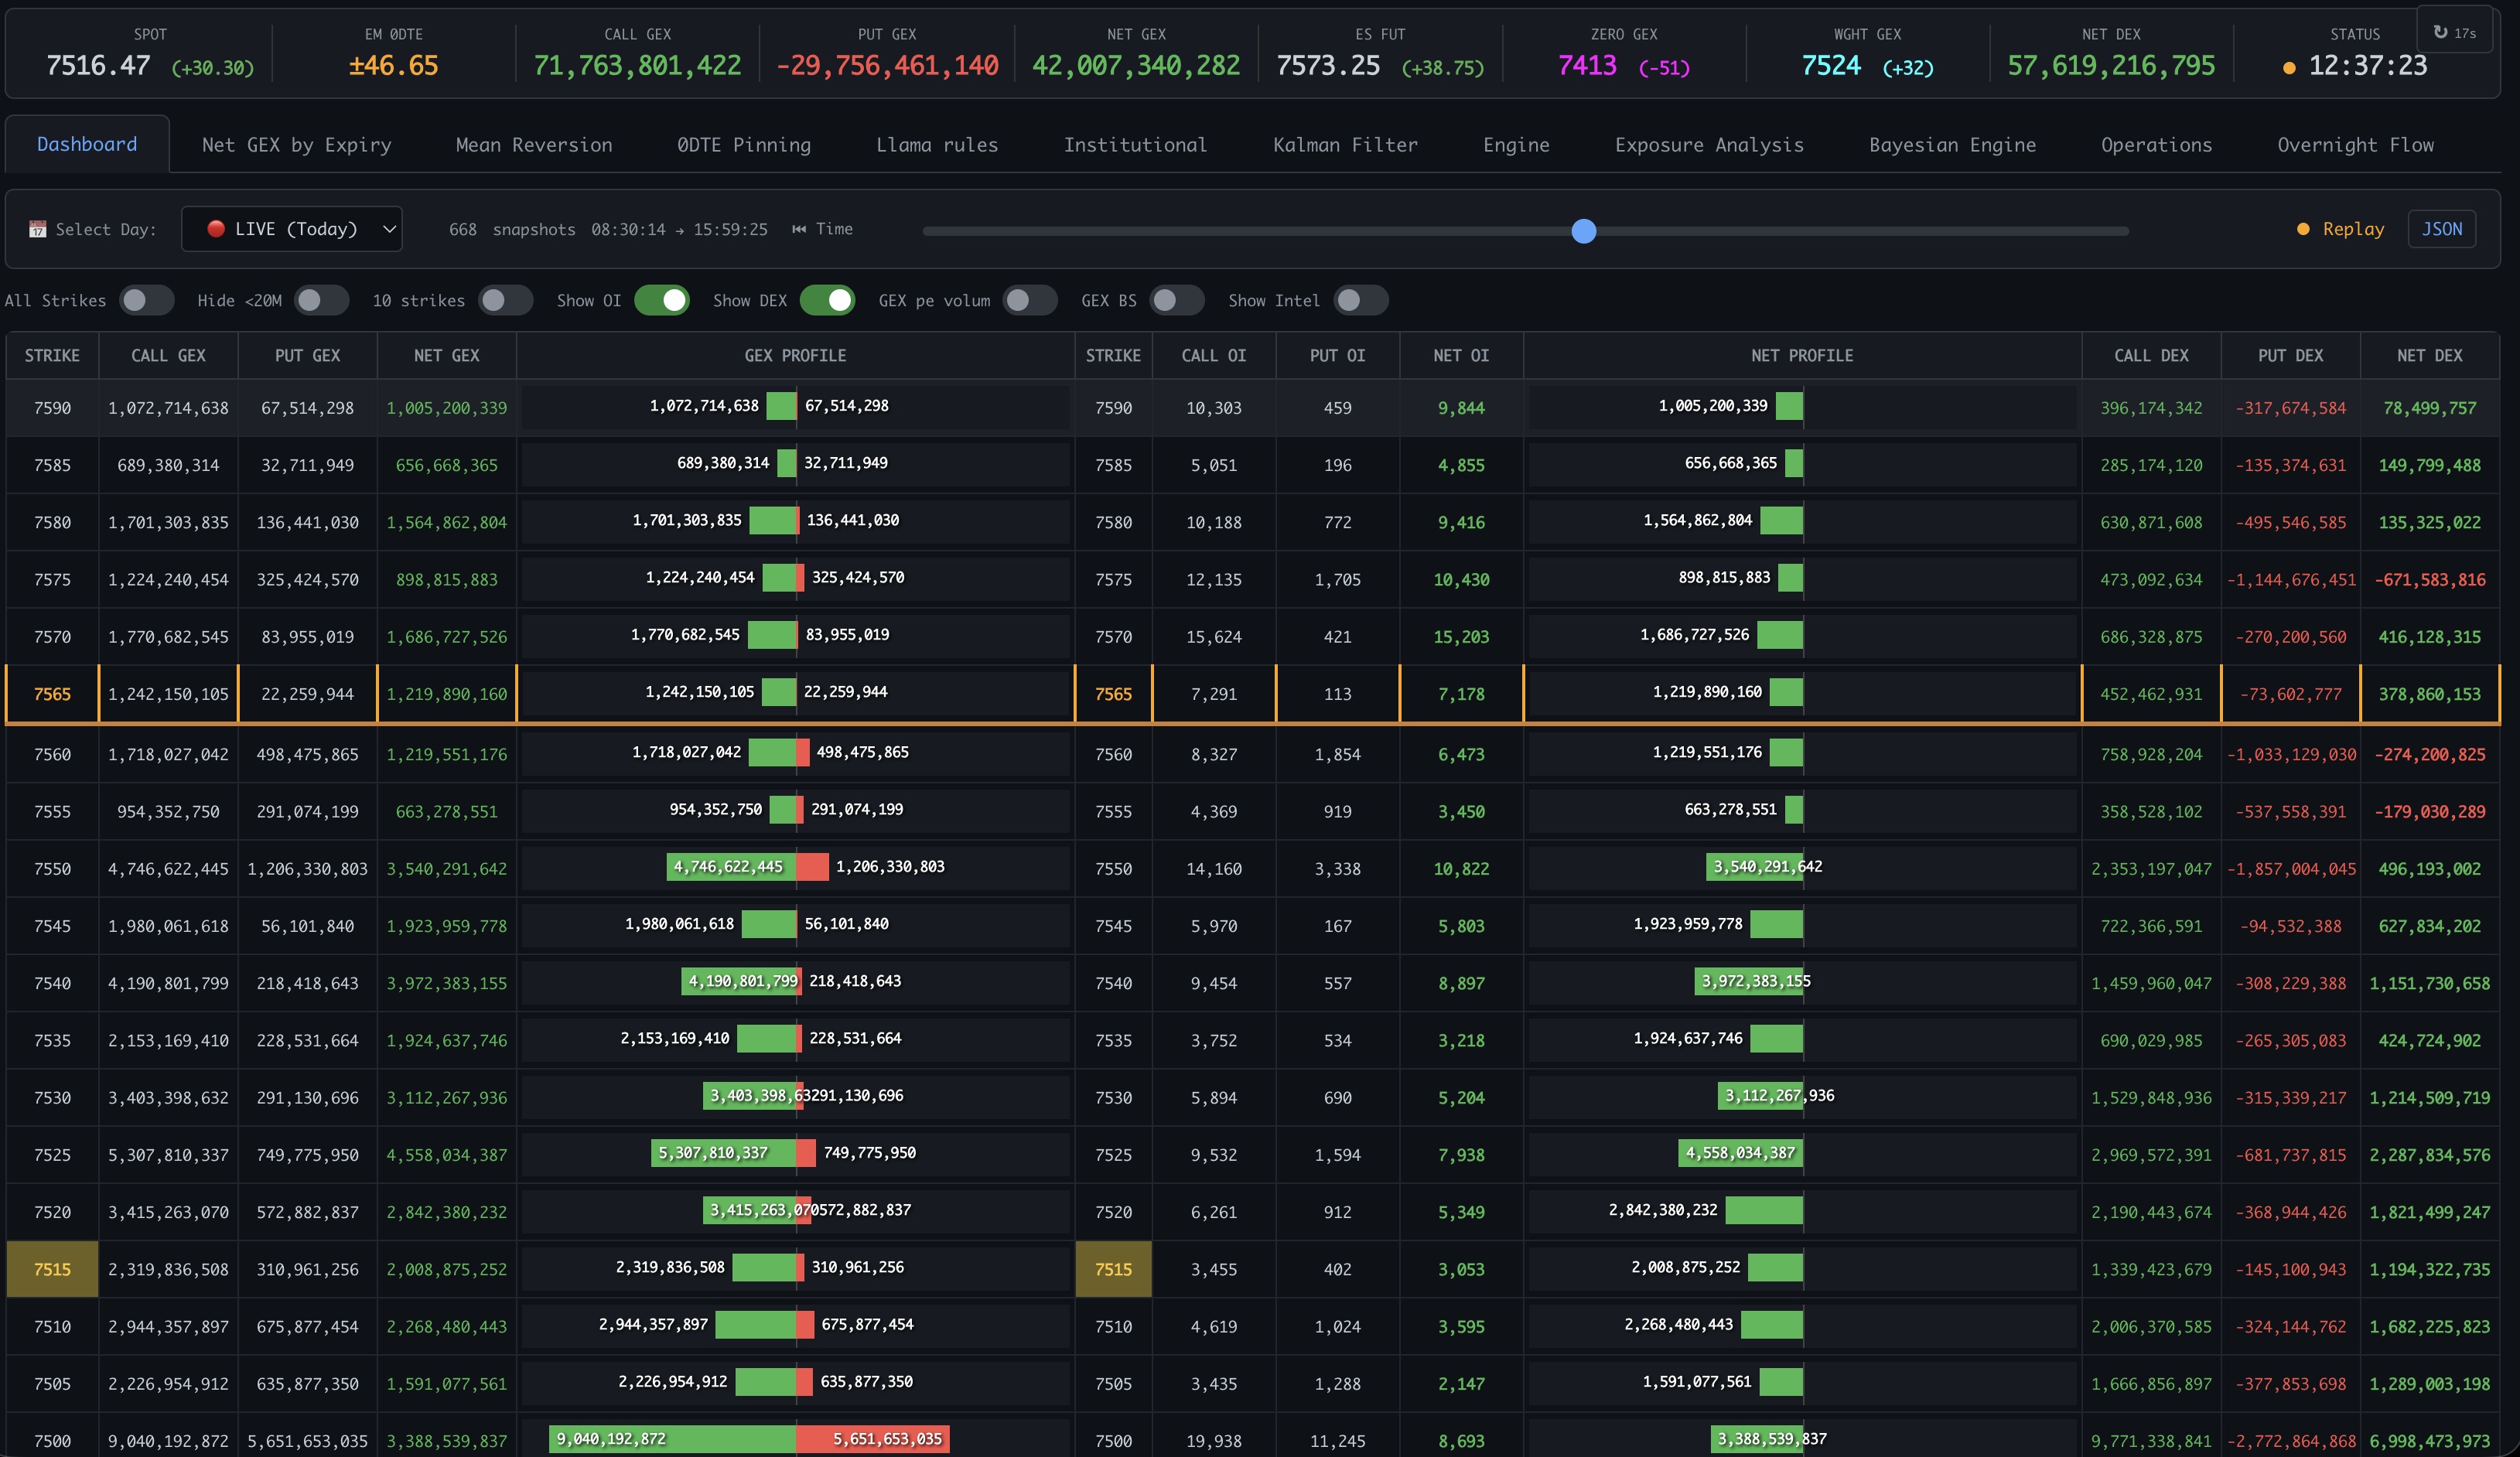
| GEX / DEX Analytics | Call Wall, Put Wall, Gamma Flip, Liquidity Void, Vanna & Charm flows |
| Market Forces | Synthesized into a single, intuitive dashboard score |
| Statistical Implied Vector | Where the market is statistically biased to move, based on all forces |
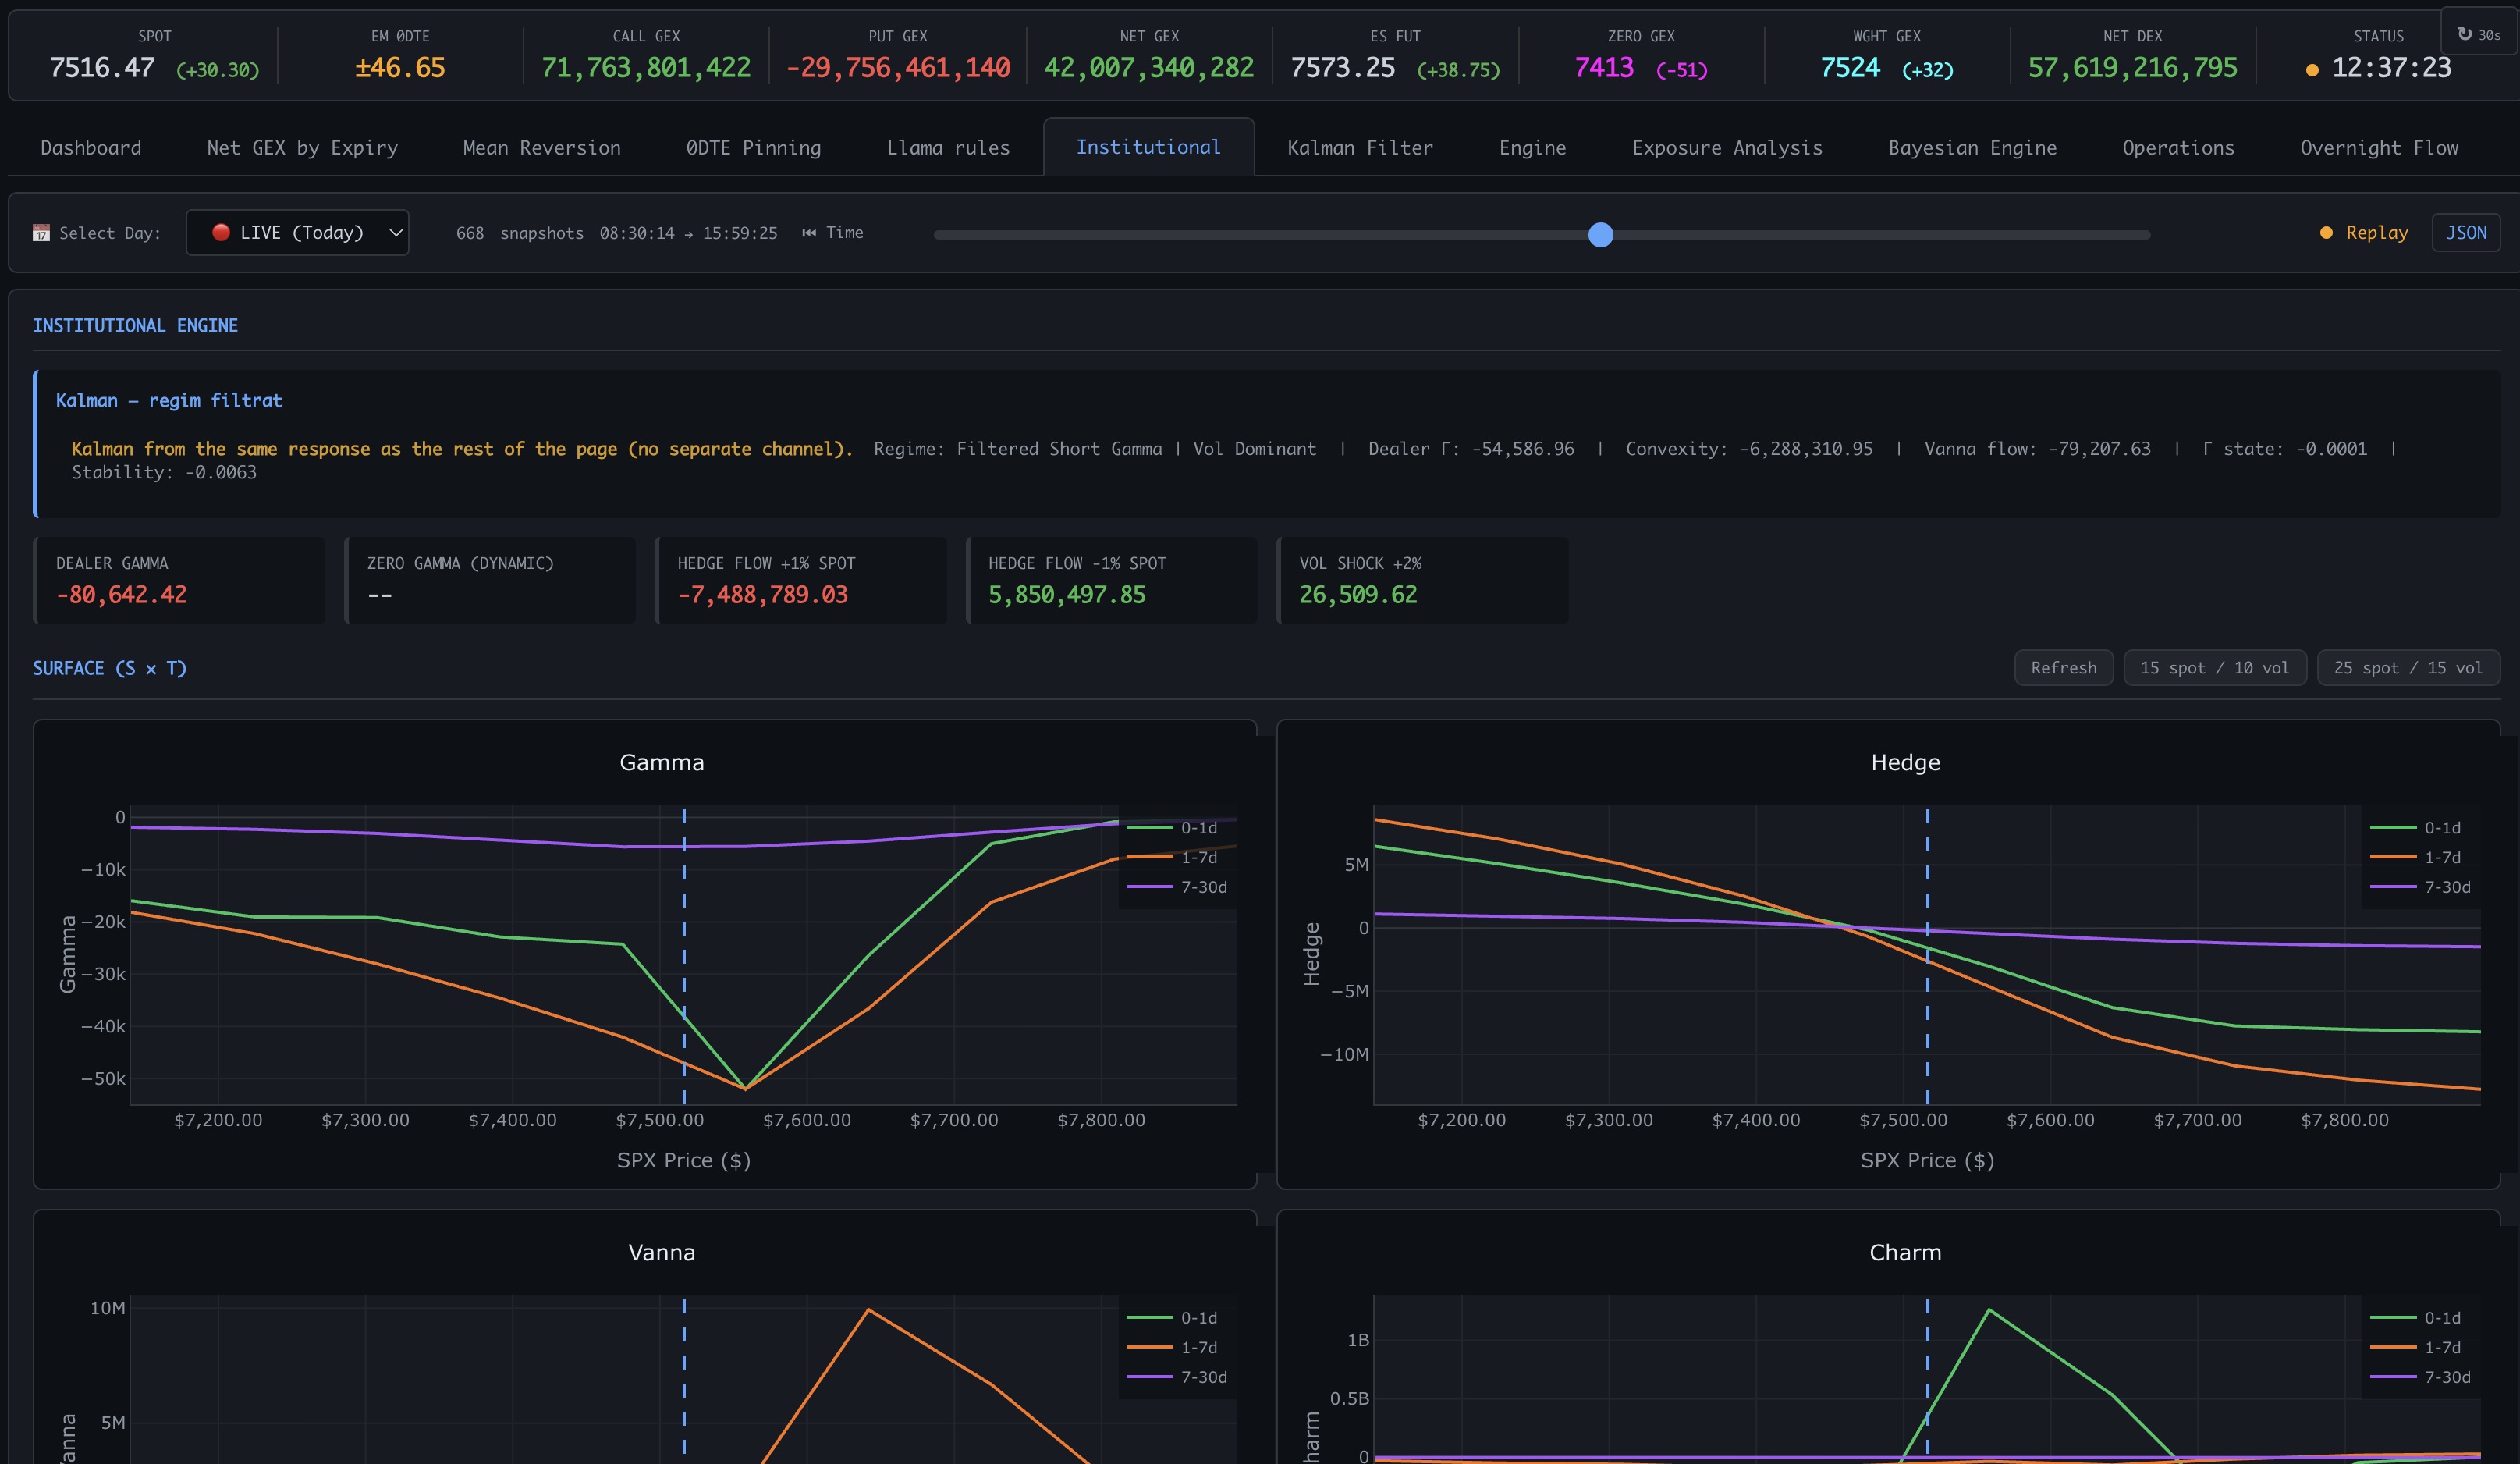
| Kalman-Filtered Z-Scores | Zero-lag adaptive smoothing — more accurate than rolling windows |
5-Year Projections (Conservative)
| Metric | Year 1 | Year 2 | Year 3 | Year 4 | Year 5 |
| Active Clients (End of Year) | 65 | 213 | 557 | 990 | 1,460 |
| Total Revenue | $221,445 | $680K | $1.75M | $3.01M | $4.32M |
| ↳ Hardware Revenue | $86,115 | $236,765 | $606K | $948K | $1.28M |
| ↳ Subscription Revenue (Collected) | $116,220 | $381K | $996K | $1.77M | $2.61M |
| End-of-Year ARR | $116K | $381K | $996K | $1.77M | $2.61M |
| EBITDA | −$8,705 | $193,477 | $642,214 | $1,021,590 | $1,685,630 |
| EBITDA Margin | −4% | 28% | 37% | 34% | 39% |
Exit: $16.8–25.2M (10-15x multiple on EBITDA) · Investor ROI: ~2.4x–3.5x on $500K @ $5M cap
For Traders (45 sec)
"I lost $25,000 in a single day because I couldn't see that the market had shifted regime. From that pain, I built Zedcrit — a hardware appliance that tells you, in real time, whether you're in an uptrend, downtrend, sideways, or high volatility regime. It's plug-and-play, 100% private, and costs $0/month in data fees."
For Investors / VCs (60 sec)
"0DTE options now account for 50%+ of SPX volume. But every existing tool was built for 30-day options — they use lagging indicators, single-paradigm models, and fixed weights.
0DTE requires a fundamentally different approach. It requires multi-paradigm fusion in real-time.
Zedcrit Terminal fuses SEVEN mathematical paradigms: Kalman Innovation for zero-lag regime detection, GEX Analytics for dealer positioning, Bayesian Inference for probability surfaces, Institutional Flow for smart money detection, Machine Learning for optimal force weighting, Risk-Neutral Measures for volatility pricing, and Extreme Value Theory for tail risk estimation.
40 dimensional forces — directional, kinetic, and frictional — are synthesized into a unified decision space using Welford's Online Variance.
The result is a Statistical Implied Vector that mathematically reveals, in real time, where the market is statistically biased to move. No other system does this. Because no one else has built the mathematics."
| Company | Zedcrit |
| Product | Zedcrit Terminal — Quant Intelligence Appliance |
| Category | Fintech / Quantitative Analytics / Hardware-Enabled SaaS |
| Founded | 2024 |
| Legal Structure | C-Corp (planned) |
| Location | US-based (remote) |
| Website | Zedcrit.com |
| Mission | "Democratize institutional-grade quantitative intelligence — accessible, affordable, and private for every active trader." |
The Problem
Retail options traders are at a structural disadvantage against institutional players. The single biggest cause of trading losses is not a bad strategy — it's misidentifying the market environment.
| What You Think | Market Reality | Result |
| "It's a choppy day" | Strong downtrend | Sell premium → blown out |
| "It's a trend" | Sideways range | Trend-follow → get chopped |
| "It's a pullback" | Regime shift | Average in → losses compound |
| "Low volatility" | High volatility | Get stopped out repeatedly |
Institutional vs. Retail: The Quant Gap
✅ Hidden Markov Models
✅ Kalman Filters
✅ GEX Analytics
✅ Market Forces Synthesis
✅ Real-time regime classification
❌ Moving averages (lagging)
❌ RSI (generic)
❌ MACD (delayed)
❌ Gut feeling (unreliable)
❌ No regime detection
The Pain: You're fighting with stone tools against opponents using laser-guided missiles.
"I've been trading 0DTE for 4 years. I've tried everything — SpotGamma, Cboe, custom Python scripts. Nothing comes close to Zedcrit. The regime detection caught a reversal 17 minutes before my usual indicators. Saved me $8,000 in one day."
— Early Adopter, $420K account
We interviewed 15+ active options traders. Their responses validated the problem at scale:
Trader Quotes
"I lost $12,000 because I thought it was a pullback. It was a regime shift. If I'd had a system telling me, I'd have been out."
"I pay $1,200/month for data and still feel like I'm flying blind."
"I'm a coder, and even I find it impossible to build a full GEX + regime detection system. The complexity is staggering."
No solution delivers the full combination of HMM Regime Detection + GEX + Market Forces + Privacy + $0 data cost in a plug-and-play form factor.
| SpotGamma | OptionMetrics | Cboe LiveVol | SpiderRock | ORATS | DIY Python | TradingView | Zedcrit Terminal | |
| HMM Regime Detection | ❌ | ❌ | ❌ | ❌ | Partial | Possible | ❌ | ✅ Yes |
| Complete GEX Analytics | Partial | ✅ Yes | ✅ Yes | ✅ Yes | ✅ Yes | Possible | ❌ | ✅ Yes |
| Market Forces | ❌ | ❌ | ❌ | ❌ | ❌ | ❌ | ❌ | ✅ Yes |
| 100% Private (Local) | ❌ Cloud | ❌ Cloud | ❌ Cloud | ❌ Cloud | ❌ Cloud | ✅ Local | ❌ Cloud | ✅ Yes |
| Live Data Cost | $1,000+/mo | $0 (EOD) | $2,000+/mo | $3,000+/mo | $500+/mo | $100+/mo | $0–50/mo | $0 (Schwab API) |
| Monthly Software Cost | $1,000+ | $5,000+ | $3,000+ | $3,500+ | $1,000+ | $100+ | $0–50 | $149 (all-in) |
| Setup | 5 min | Months | Days | Weeks | Days | Months | 2 min | 30 seconds |
| Technical Skill | Low | High (Quant) | Medium | High (API) | Medium | Very High | Low | None |
| IP Protection | N/A | N/A | N/A | N/A | N/A | Exposed | N/A | ✅ TPM 2.0 |
The Solution
Zedcrit Terminal is a purpose-built Mini PC hardware appliance that brings institutional-grade quantitative intelligence to your desk. It plugs into your Ethernet, runs completely locally, and becomes operational in under 5 minutes.
| Step | Action | Time |
| 1 | Unbox and connect power + Ethernet | 2 min |
| 2 | Open browser → http://zedcrit.local | 30 sec |
| 3 | Enter your Schwab API token | 60 sec |
| 4 | Trade with quantitative clarity | Immediately |
Use Case: The 0DTE Trader's Morning
| Time | Trader Action | Zedcrit Terminal |
| 9:30 AM | Opens position | Regime detected: Sideways |
| 10:15 AM | Price drops slightly | Kalman Innovation detects "surprise" |
| 10:16 AM | Trader is alerted | Regime Shift: Downtrend |
| 10:17 AM | Exits position | Minimal loss vs. catastrophic loss |
| 10:30 AM | Price drops 50 points | Trader is in cash, protected |
| Result: A $500 manageable loss instead of a $25,000 account blow-up. | ||
Market Forces Covered
| Category | Forces |
| Order Flow | CLV (Cumulative Close Location Value), Tick Velocity, Speculative Pressure |
| Volatility | GK Volatility, Relative Volume, Volatility Spring, IV Skew |
| Greeks | Net GEX, Vanna, Charm, Speed, Color, Vomma |
| Institutional | Directional Delta, Breadth Gravity, Hedge Gravity, Arbitrage Force |
| Market Structure | Call Wall, Put Wall, Gamma Flip, Liquidity Void, Expected Pin |
| Momentum | Acceleration, Efficiency Ratio, Fractal Dimension, Overlap Ratio |
| Risk | Implied Skewness, Risk Premium Index, Tail Loss Measure |
Zedcrit fuses 7 mathematical paradigms across 11 technical layers, creating a coherent engine that is mathematically inimitable and physically secure.
| Foundational Infrastructure | Layer 1: Data Ingestion — Polars (1-min rolling OHLCV), DuckDB, Real-time Schwab WebSocket |
| Paradigm 1: Stochastic State Estimation | Layer 2: Kalman Innovation — Zero-lag regime detection. Innovation = Actual - Predicted |
| Paradigm 2: Options Flow Analytics | Layer 3: GEX Analytics — Call/Put Walls, Gamma Flip, Liquidity Voids, Vanna & Charm, Net GEX |
| Paradigm 3: Bayesian Inference | Layer 4: Probability Surfaces — P(Regime | New Data) updated instantly from Kalman Innovation |
| Paradigm 4: Institutional Flow | Layer 5: Smart Money Detection — ES Basis Arbitrage, Breadth Gravity, Directional Delta, Mag7 Pull |
| Paradigm 5 & 6: Risk-Neutral & Extreme Value | Layer 6: Risk-Neutral Measures — BKM implied variance, SVIX premium, Corridor VIX |
| Layer 7: Extreme Value Theory — GPD fitted to OTM puts for tail risk & crash probability | |
| Paradigm 7: ML Calibration & Synthesis | Layer 8: Welford Online Variance — Bounds ANY force into [-3, +3] Sigma with O(1) updates |
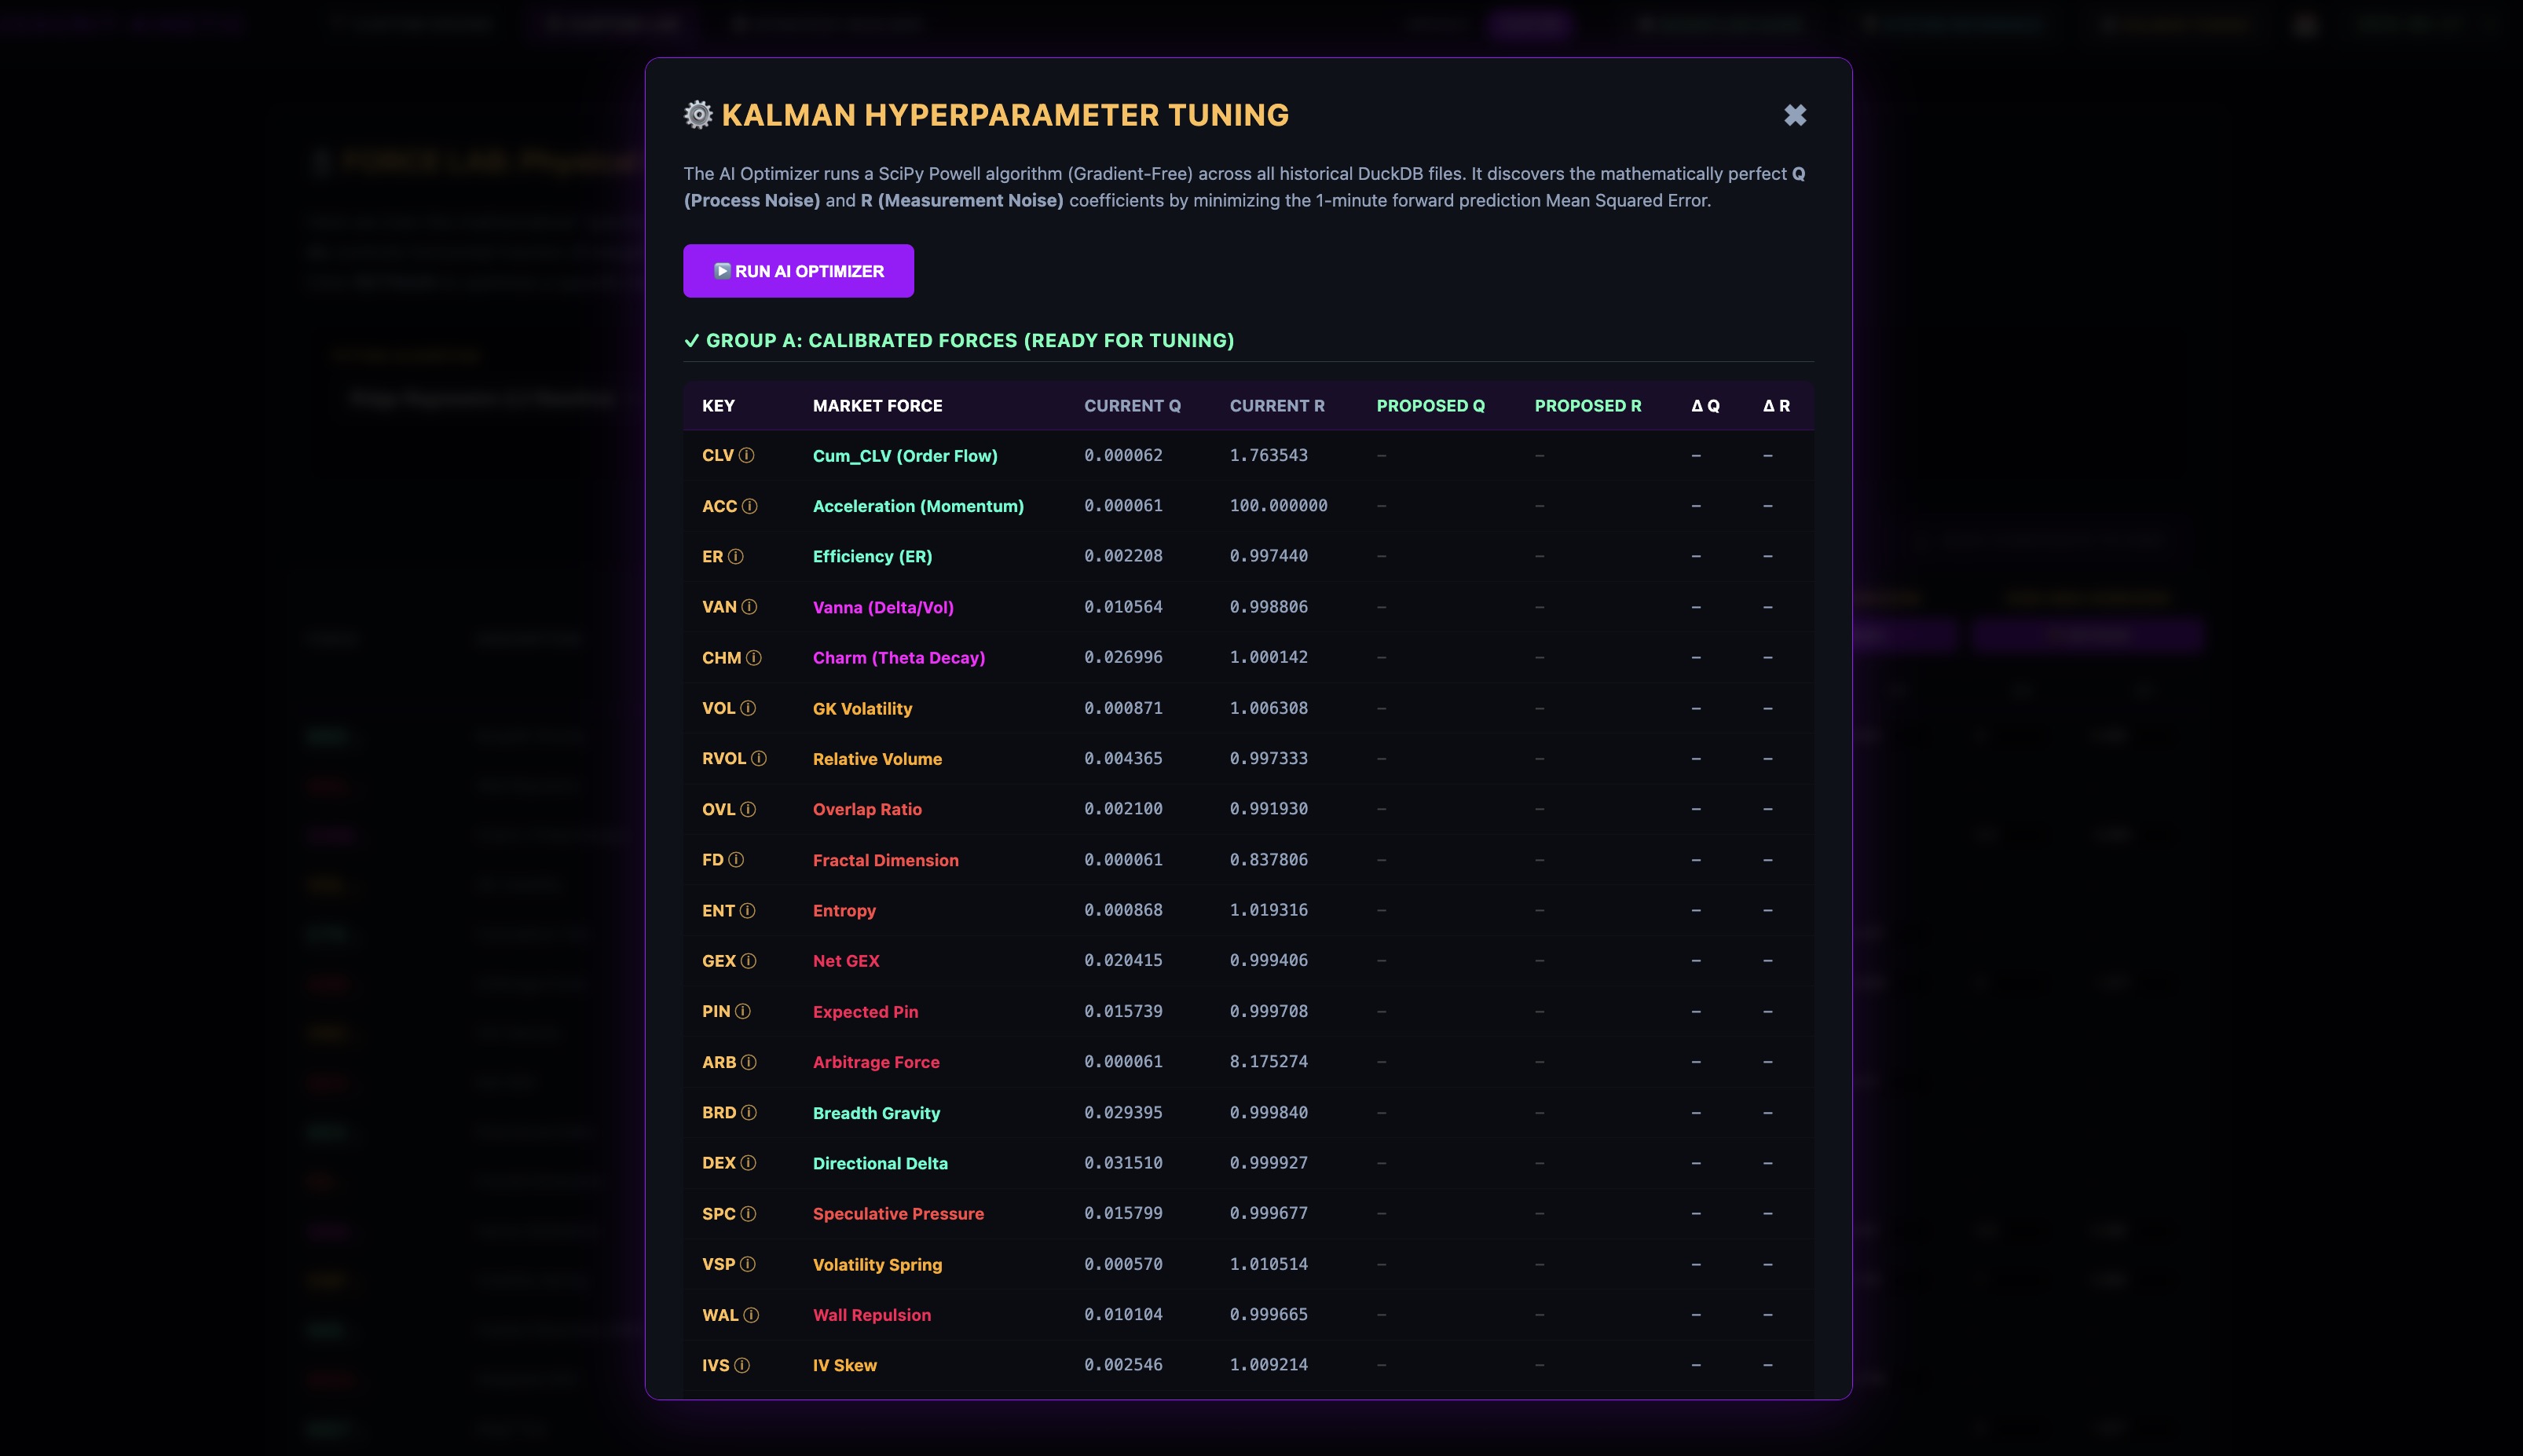
| Layer 9: ML Calibration — Exhaustive Search + AIC validation + Huber/ElasticNet to optimize weights | |
| Output & Visualization | Layer 10: 2D Phase Space Vector — Synthesizes Directional (Y), Kinetic, and Frictional (X) forces into (dx, dy) |
| Hardware Security | Layer 11: IP Protection — Nuitka compilation, TPM 2.0, LUKS encryption, Remote Kill-Switch |
We live in the era of "vibe coding." A developer can clone a UI overnight. They cannot clone Zedcrit.
| Threat | How Hardware Solves It |
| IP Theft | Algorithms locked in TPM 2.0. Physically and economically infeasible to extract. |
| Data Costs | Cloud SaaS for 1,500 users = $75K–$110K/month AWS + institutional data licensing. Our edge model = <$20/user. (Annual savings of $540K-$954K). Margin preserved. |
| Privacy | Portfolio, P&L, and trade data never leave the client's desk. Zero transmission. |
| Latency | Zero cloud round-trip. All math at the edge. Sub-millisecond updates. |
| Perceived Value | A physical device on your desk commands premium pricing — the retail Bloomberg Terminal analogy. |
We do not file patents — patents require public disclosure. Our algorithms are protected by a layered trade secret strategy:
| Asset | Protection Method | Status |
| HMM Regime Detection Algorithm | Trade Secret + TPM 2.0 hardware encryption | Protected |
| Forces Synthesis Engine | Trade Secret + TPM 2.0 hardware encryption | Protected |
| Kalman Filter Implementation | Trade Secret + TPM 2.0 hardware encryption | Protected |
| All Python Source Code | Copyright + Nuitka compilation (prevents decompilation) | Protected |
| Brand / Trademarks | Trademark registration | Planned |
SEC / FINRA — Not Investment Advice
Our analytics are strictly impersonal. They do not consider the user's risk profile, portfolio size, or financial goals — the fundamental SEC threshold for "investment advice." Every output uses statistical terminology (e.g., "Statistical Implied Vector") rather than trade recommendations ("Buy," "Sell").
OPRA Data Distribution — BYOD Model
Zedcrit operates on a Bring Your Own Data (BYOD) model. The client connects their own personal retail API key. All calculations happen locally on their hardware. Zero transmission of derived data back to our servers. Legally equivalent to a complex Excel macro running on the client's own laptop.
| Legal Element | Our Approach |
| Terminology | "Statistical Implied Vector" · "Historical Probability Level" · Never "Predicted Target" or "Trade Signal" |
| User Control | 100% of buy/sell decisions are made independently by the user. The system provides analytics, not actions. |
| Data Handling | Client's API key on client's hardware. Zero trading data retention. Minimal metadata (email, billing) stored encrypted. |
| EULA | Explicit language: analytical tool, not financial advisor. |
Market Opportunity
| Market | Size | Definition |
| TAM | $500M+ | Global market for options analytics, quantitative data, and institutional tools |
| SAM | $150M | Active Schwab/ThinkOrSwim options traders + existing GEX platform users (US focus) |
| SOM (5-year target) | $3M+ | ~1,460 active units — <1% of our SAM. Extremely conservative. |
Proof of Traction
| Metric | Result |
| Retention | 90% after 30 days |
| Equivalent MRR | $2,400 (projected) |
| Satisfaction Score | 4.8/5 |
Key Market Tailwinds
| Metric | 2020 | 2024 | 2026 (est.) |
| Daily options volume | 20M contracts | 45M+ | 60M+ |
| Retail options traders (US) | 2M | 10M+ | 15M+ |
| 0DTE volume as % of SPX | 20% | 50%+ | 60%+ |
0DTE options now account for the majority of SPX volume. These instruments require real-time regime detection — lagging indicators are structurally useless. Zedcrit is built precisely for this.
| Capability | SpotGamma | Cboe | ORATS | Bloomberg | Zedcrit |
| Zero-Lag Detection | ❌ | ❌ | ❌ | ❌ | ✅ Kalman |
| GEX Analytics | Partial | ✅ | Partial | ❌ | ✅ Complete |
| Bayesian Inference | ❌ | ❌ | ❌ | ❌ | ✅ |
| Institutional Flow | ✅ | ❌ | ❌ | ❌ | ✅ |
| Risk-Neutral Measures | ❌ | Partial | ❌ | ✅ | ✅ BKM/SVIX |
| Extreme Value Theory | ❌ | ❌ | ❌ | ❌ | ✅ GPD |
| ML Calibration | ❌ | ❌ | ❌ | ❌ | ✅ ElasticNet |
| 40-Force Synthesis | ❌ | ❌ | ❌ | ❌ | ✅ |
| 2D Phase Space | ❌ | ❌ | ❌ | ❌ | ✅ |
| Hardware-Protected IP | ❌ | ❌ | ❌ | ❌ | ✅ TPM 2.0 |
| 0DTE-Specific | ❌ | ❌ | ❌ | ❌ | ✅ |
Why 0DTE Changes Everything
0DTE is not "just another option." It is a fundamentally different asset class that breaks traditional 30-day models. This is why our Multi-Paradigm approach is strictly necessary.
| 0DTE Characteristic | Implication | Why Legacy Tools Fail |
| Extreme Time Decay | Option loses 50% of value in 30 mins | 30-60 min lag = tool is completely useless |
| Rapid Gamma Expansion | Dealers hedge aggressively intraday | GEX must be updated by the second |
| Intraday Volatility | Regimes shift in minutes | HMMs must be continuously re-trained |
| Liquidity Voids | Prices gap through thin liquidity zones | Linear models fail structurally |
Macro Trends Favoring Zedcrit
| Trend | Why It Benefits Zedcrit |
| 0DTE Revolution | 50%+ of SPX volume — demands second-by-second regime detection. Lagging indicators fail. HMM wins. |
| Democratization of Quant | Retail traders want institutional-quality tools at accessible prices. Willingness to pay is rising. |
| Cloud Privacy Backlash | Data breaches rising. Traders want local control of strategy, P&L, and positions. We are the answer. |
| Commission Elimination | Zero commissions → traders have more capital to invest in analytical tools and edge. |
Primary: The Active Options Trader
| Attribute | Profile |
| Age | 30–55 |
| Account Size | $50,000 – $500,000 |
| Trading Frequency | Multiple times per week (0DTE / weekly options) |
| Current Spend on Tools | $500 – $2,000/month |
| Primary Pain | Losing money from misidentified market regimes |
| Technical Skill | Low to medium |
| Platform | Schwab / ThinkOrSwim, IBKR, Tradier |
Secondary: Small Proprietary Trading Firms (2–10 traders)
Higher willingness to pay, buys multiple units, qualifies for Enterprise pricing — a high-LTV segment we address in Year 2.
We do not rely solely on expensive paid ads. Our Community-Led Growth strategy is built on a 6-stage self-liquidating funnel called Zero Day Spartan. By offering high-value trading mindset education (free eBooks and a "Pay What You Want" book bundle), we aim to drastically reduce our net CAC (as frontend book sales offset ad spend). Once trust is established via our automated email sequences, we upsell the Zedcrit Terminal as the ultimate hardware solution to their trading pain. Crucially: while this funnel is designed for hyper-efficiency, we modeled our financial projections using a highly pessimistic $1,200 CAC (and a realistic $800 CAC), ensuring the business remains highly profitable even in worst-case scenarios.
Dual-Hardware Strategy: By introducing the premium Zedcrit Pro at $1,499, we create a powerful pricing anchor. This market segmentation allows us to capture high-volume traders and prop firms while making the $799 Zedcrit Core feel like exceptional value for entry-level traders, accelerating overall conversion and creating a natural upgrade path.
| Scenario | Description | Estimated CAC | LTV/CAC |
| Pessimistic | Paid ads + paid influencers exclusively | $1,200 | 3.6 : 1 |
| Realistic | 50% organic / 50% paid mix | $800 | 5.4 : 1 |
| Optimistic | Community-led growth, organic focus | $450 | 9.5 : 1 |
CAC Evolution Simulation
Testing (Paid)
Optimization (Mix)
Scaling (Organic)
Business Model
| Revenue Stream | Price | Cost | Margin | Role |
| Zedcrit Core (one-time) | $799 | $350 | ~56% | Entry-level gateway |
| Zedcrit Pro (one-time) | $1,499 | $750 | ~50% | High-LTV premium tier |
| Software Maintenance (monthly) | $149/mo | <$20/mo | >85% | Primary profit engine |
| Zedcrit Care (optional) | $49/mo | <$1/mo | ~98% | Support/replacement revenue |
| Component | Monthly | Average Lifetime (20 months) |
| LTV (Zedcrit Core) | — | $4,073 |
| LTV (Zedcrit Pro) | — | $4,773 |
1. LTV is calculated conservatively: We modeled the LTV over just 20 months (5% monthly churn), which is extremely conservative for a hardware-SaaS product. In reality, hardware creates strong lock-in — a trader paying $799 upfront does not easily abandon the device after 20 months. We prefer to project conservatively and surprise positively.
2. Secondary market = Infinite LTV: When a trader quits, they don't discard a $799 device; they resell it (e.g. on eBay or Discord). The new owner must activate a $149/mo SaaS subscription to unlock it. This means each hardware unit can generate multiple LTV cycles — with the second cycle having a $0 CAC. We did not model this in our baseline, but it represents significant unmodeled upside.
3. 5.4:1 LTV/CAC is among the best in FinTech: For context, Robinhood has an estimated LTV/CAC of ~1.5:1. TradingView operates at ~2.5:1. Zedcrit achieves 5.4:1 in our base case and 9.5:1 in our optimistic case, meaning every $1 invested in marketing returns between $5.40 and $9.50 in long-term value.
4. Natural upgrade path (Core → Pro): As traders grow their accounts and profitability, they naturally upgrade from Zedcrit Core ($799) to Zedcrit Pro ($1,499). This organic upgrade expands the LTV without any additional acquisition costs, an upside we intentionally excluded from the base case.
Pricing vs. Competition
| Solution | Monthly | Annual | 3-Year Total |
| Zedcrit Terminal ✓ | $149 | $2,587 (incl. hardware) | $6,163 |
| SpotGamma Enterprise | $1,000+ | $12,000+ | $36,000+ |
| Cboe Terminal | $500+ | $6,000+ | $18,000+ |
| Bloomberg Terminal | $2,000+ | $24,000+ | $72,000+ |
- $799 Zedcrit Core / $1,499 Zedcrit Pro — The dual-hardware approach anchors the price, making the $799 Core feel like an exceptional bargain while providing a premium option for high-end traders. Both feel like professional, tax-deductible equipment purchases.
- $149/month — Below the psychological $150/month threshold. Less than most traders already spend on inadequate tools.
- $49/month Care — Feels optional and affordable. Converts support cost into a ~98% margin revenue stream.
- Pain-based value framing — "One prevented regime misread pays for the entire system." A $5,000 loss averted makes the upfront cost feel trivial.
Break-even Analysis for a Typical User
| Metric | Value |
| Cost total Year 1 (Zedcrit Core) | $2,587 ($799 + $149 × 12) |
| Alternative (SpotGamma + Data) | $14,400 ($1,200 × 12) |
| Annual Saving | $11,813 |
| Break-even | 2.2 months |
Financial Projections (5 Years)
investors only suffer a partial loss (0.5x-0.8x ROI)
Best case: 5-8x+ return
Note: Projections assume a ~228% Year-over-Year growth rate in Year 2, supported by our CAC optimization strategy.
Pessimistic Year 1 Downside: Even if we only deploy 40 units in Year 1 (50% miss), our highly optimized burn rate extends our runway beyond 20 months, allowing us to hit Year 2 milestones without a bridge round.
| Metric | Year 1 | Year 2 | Year 3 | Year 4 | Year 5 |
| New Clients Acquired | 85 | 235 | 580 | 890 | 1,190 |
| Active Clients | 65 | 213 | 557 | 990 | 1,460 |
| ── REVENUE ── | |||||
| Hardware Revenue | $86,115 | $236,765 | $605,520 | $947,710 | $1,284,010 |
| End-of-Year ARR | $116,220 | $380,840 | $995,920 | $1,770,120 | $2,610,480 |
| Care Revenue | $19,110 | $62,622 | $153,174 | $291,060 | $429,240 |
| Total Revenue (Hardware + SaaS) | $221,445 | $680,227 | $1,754,614 | $3,008,890 | $4,323,730 |
| ── COSTS ── | |||||
| Hardware COGS | $40,150 | $110,750 | $277,400 | $431,300 | $582,100 |
| CAC (Marketing) | $34,000 | $94,000 | $290,000 | $623,000 | $714,000 |
| Operations | $40,000 | $90,000 | $180,000 | $350,000 | $550,000 |
| Salaries / Contractors | $60,000 | $120,000 | $240,000 | $380,000 | $520,000 |
| R&D | $20,000 | $50,000 | $90,000 | $150,000 | $200,000 |
| Legal & Admin | $35,000 | $20,000 | $30,000 | $45,000 | $60,000 |
| Hardware RMA Reserve (2%) | $1,000 | $2,000 | $5,000 | $8,000 | $12,000 |
| Total Costs | $230,150 | $486,750 | $1,112,400 | $1,987,300 | $2,638,100 |
| ── RESULTS ── | |||||
| EBITDA | −$8,705 | $193,477 | $642,214 | $1,021,590 | $1,685,630 |
| EBITDA Margin | −4% | 28% | 37% | 34% | 39% |
Operational Scaling
As we scale our hardware-as-a-service model, we are preparing key logistical milestones: expanding our Just-In-Time Amazon Prime fulfillment for international shipping, leveraging OEM 1-year limited warranties, and scaling a dedicated tier-1 technical support protocol for rapid hardware replacements to minimize downtime for active traders.
Financial technology and retail trading platforms trade at 10x–15x EBITDA (a conservative multiple for highly profitable Hardware-SaaS hybrids). At Year 5 EBITDA (~$1.68M), this yields an expected exit valuation of $16.8M – $25.2M. We also model an ultra-conservative 8x multiple, justified by our hybrid hardware-SaaS structure (even though over 70% of Year 5 revenue is high-margin recurring SaaS).
| Target Acquirers (Retail Fintech) | Why they would acquire Zedcrit |
| Robinhood / Webull | To offer a premium, institutional-grade product to their most active options traders. |
| TradeStation / TradingView | Deep integration into their existing routing or charting ecosystems to attract options volume. |
| Scenario | Multiple | Year 3 Exit | Year 5 Exit |
| Worst Case (8x) | 8x EBITDA | $4.5M | $13.4M |
| Conservative | 10x EBITDA | $5.6M | $16.8M |
| Optimistic | 15x EBITDA | $8.4M | $25.2M |
| Our Estimate | Blended | $6–8M | $16.8–25.2M |
$500K @ $5M cap = 10% initial ownership (~7.0% effective after standard 30% dilution).
Base Case (Conservative — 1,460 clients in Year 5)
| Scenario | Exit Valuation | Investor Share (Post-Dilution ~7.0%) | Return Multiple |
| Worst Case (8x) | $13.4M | $938K | 1.9x |
| Conservative (10x EBITDA) | $16.8M | $1.18M | 2.4x |
| Optimistic (15x EBITDA) | $25.2M | $1.76M | 3.5x |
Upside Case (Aggressive — 3,500+ clients in Year 5)
| Scenario | Exit Valuation | Investor Share (Post-Dilution ~7.0%) | Return Multiple |
| Conservative (10x EBITDA) | $38.0M | $2.66M | 5.3x |
| Optimistic (20x EBITDA) | $76.0M | $5.32M | 10.6x |
• CAC optimization: If our optimistic $450 CAC materializes, we acquire clients 44% faster.
• Prop firm adoption: One prop firm = 5+ units at near-zero marginal CAC.
• Broker partnerships: TradingView, Webull, or Robinhood integration unlocks substantial user bases.
• Secondary market: Every churned unit resells at $0 CAC — pure upside we don't model.
| Scenario | Year 5 Clients | Year 5 ARR | Year 5 EBITDA | Exit Valuation | Investor ROI |
| Worst Case | 500 | $894K | ~$350K | $3.5–5.0M | 0.5x–0.7x |
| Base Case | 1,460 | $2.61M | $1.68M | $16.8–25.2M | 2.4x–3.5x |
| Upside Case | 3,500+ | $6.26M+ | $3.8M+ | $38.0–76.0M | 5.3x–10.6x |
Key Insight: Even in the worst case (500 units total, 33% of our base case), the company generates ~$350K EBITDA and exits at $3.5–5M — still a ~0.5x–0.7x ROI (partial loss of capital) on a $500K pre-seed investment. The downside is heavily protected. The upside potential is compelling.
The Ask — Milestone-Based SAFE
We are raising $500,000 on a SAFE at a $5M Valuation Cap (Post-Money). We proactively propose a Milestone-Based Tranche Structure — capital deployment maps precisely to risk reduction. This tranche structure is explicitly designed to test our actual CAC against our conservative models before scaling capital deployment. You don't fund speculation; you fund proven execution.
Finalizes prototype, establishes legal foundation, deploys first physical units.
Acquires initial paying customers, procures commercial batch.
Prepares Year 2 volume, expands broker integrations, aggressively acquires customers.
| Instrument | SAFE (Simple Agreement for Future Equity) |
| Total Raise | $500,000 |
| Valuation Cap | $5,000,000 (locked for all tranches) |
| Monthly Burn | ~$18,000 |
| Runway | 15–18 months (including revenue offset) |
| Break-Even | Year 2 (Month ~18) |
| Category | Total Allocation | Primary Use |
| R&D | $180,000 | UI/UX finalization, IBKR/Tradier integrations, HMM algorithm updates |
| Hardware | $76,000 | Acquiring hardware inventory & prototypes |
| Marketing (CAC) | $68,000 | Influencer partnerships, community building, paid acquisition tests |
| Legal & IP | $50,000 | IP protection, entity formation |
| Operations & Buffer | $126,000 | Fixed monthly costs ($80K), contingency ($46K) |
| Total | $500,000 |
| Milestone | Target | Timeline |
| First commercial unit shipped | 1 unit | Month 6 |
| 85 units sold (Year 1 goal) | 85 units | Month 12 |
| $10K+ MRR from subscriptions | ~50 active subscribers | Month 10–12 |
| Break-even (EBITDA > $0) | ~150 active clients | Month 18 |
| 235 new units (Year 2) | 213 active clients | Month 24 |
| $500K+ ARR | 215 active subscribers | Month 24 |
| 5+ broker integrations | Schwab, IBKR, Tradier + 2 more | Month 24 |
Team
| Position | Type | Timing | Cost |
| UI/UX Developer | Contractor (part-time) | Month 2 | $20K/yr |
| Customer Support Specialist | Contractor (part-time) | Month 3 | $15K/yr |
| Full-Stack Developer | Full-time employee | Year 2 | $70K/yr |
| Marketing Specialist | Full-time employee | Year 2 | $60K/yr |
| Sales / Business Dev | Full-time employee | Year 3 | $60K/yr |
Risk Mitigation
| Risk | Likelihood | Impact | Mitigation |
| Schwab blocks retail API / limits | Low | High | Abstract DataProvider with UI callbacks. Phase 1: BYOD via Schwab. Phase 2: Premium backup feeds (Databento/Polygon.io) for commercial mitigation. |
| Competitor copies features | Medium | Medium | TPM 2.0 encryption + Trade Secrets + Nuitka compilation. Years and millions to replicate. |
| Hardware supply chain delays | Medium | Medium | JIT model with 2–3 unit buffer. Purchasing in bulk at 150+ units eliminates single-source risk. |
| Hardware failure / RMA | Low | Medium | ~53% blended hardware margin covers instant overnight replacement. Ultra-silent active cooling + NVMe = highly reliable. |
| SEC / FINRA compliance | Low | High | Strictly impersonal analytics. "Statistical Implied Vector" terminology. BYOD model = no data distribution liability. |
| Slower adoption | Medium | Medium | Organic channels first. Tranche structure means capital is only deployed after milestones proven. Worst case still exits at 0.5-0.8x. |
| IP theft / disclosure | Low | High | Trade Secret + TPM 2.0 + Nuitka. No public disclosure. Code runs compiled in a sealed system. |
| High churn (retail blow-ups) | Low | Medium | $799 price naturally filters gamblers. Target: $50K-$500K account holders. Zedcrit helps users survive longer, protecting LTV. |
| Actual CAC higher than estimated | Medium | Medium | Safety buffer built in. LTV/CAC remains 3.6:1 even in a pessimistic $1,200 CAC scenario. |
| Retention lower than estimate (churn > 3%) | Medium | High | Hardware creates psychological "lock-in". Zedcrit Care creates a strong support relationship that increases retention. |
Investor Materials
For Angel Investors (Ex-Traders)
"I lost $25,000 in a single day — $15K on one account, $10K on another. I thought it was choppy. The market entered a strong downtrend. I didn't recognize the regime shift in time.
From that day, Zedcrit Terminal was born. A hardware appliance running HMM Regime Detection + GEX + market forces, locally, $0 monthly data cost. We drive efficient acquisition through our "Zero Day Spartan" community funnel, yet we modeled the financials on a pessimistic $1,200 CAC (and realistic $800 CAC). Prototype validated. Raising $500K at $5M cap. 5-year projections: $2.61M ARR, $16.8–25.2M exit. Do you have 10 minutes for a demo?"
For Micro-VCs (Deep Tech / Hardware)
"We're not selling hardware. We're selling quantitative intelligence. Hardware protects IP (TPM 2.0) and eliminates cloud costs — running this on AWS for 1,500 users would cost $75K–$110K/month. Our edge model costs <$20/user (saving $540K–$954K/year)."
~53% hardware margins, ~85% software margins, LTV/CAC 5.4:1. $16.8M–$25.2M exit in 5 years. Milestone-based tranches eliminate execution risk. Would you like to see the deck?"
For Traditional VC (Fintech / SaaS)
| Metric | Base Case (Year 5) | Upside Case (Year 5) |
| ARR | $2.61M | $6.26M+ |
| EBITDA | $908K | $3.8M+ |
| Exit Valuation | $16.8–25.2M | $38.0–76.0M |
| Investor ROI ($500K @ $5M) | 1.3x–1.9x | 5.3x–10.6x |
"LTV/CAC 5.4:1. 15–18 months runway. Profitable in Year 2. Milestone tranches protect your capital. Our base case delivers solid returns; our upside case delivers VC-grade multiples. The downside is protected; the upside is massive. The math works — and the growth model is highly asymmetric."
Three reasons: IP Protection — Python code on a desktop app can be decompiled. On the Terminal, code runs compiled in a closed, TPM-encrypted system. Our HMM models are physically protected. Stability — Schwab WebSocket ingestion isn't interrupted by Windows updates or other processes. The appliance is dedicated. Performance — Polars and ClickHouse run on dedicated hardware cores. The trader's main PC stays free for execution.
We have a two-phase data strategy to mitigate platform risk. Phase 1 operates on a Bring-Your-Own-Data (BYOD) model via Schwab, keeping data costs at $0. In Phase 2, we integrate premium institutional feeds like Databento, Polygon.io, or direct OPRA licenses as a commercial backup. The system is isolated from broker-specific code through an abstract DataProvider interface; switching sources requires no rewrite of the math engine.
The JIT model is for our validation phase (first 65 units) — zero capital risk. At 150+ units, we leverage bulk volume purchasing to maintain or improve margins. We maintain a 2–3 unit buffer to eliminate delivery risk at all times.
Per our EULA, the software license suspends upon payment termination. The Terminal enters Read-Only Mode — historical data accessible, but live stream stops. To resume live trading, the client reactivates the subscription. Hardware without software is useless for active trading. This structurally protects our recurring revenue.
1. Trading Attrition: Retail trading has a natural mortality rate. Traders occasionally "blow up" their accounts by breaking their own risk rules. When they lose their capital, they pause the subscription. A 54% annual retention in retail trading is exceptionally strong.
2. The Resale Market (Zero CAC): If a trader quits, they don't throw away a $799 device. They resell it to another trader on eBay or Discord. To unlock the device, the new owner must activate the $149/mo SaaS. Essentially, a churned user's hardware automatically acquires a new user for us at a $0 net CAC.
If we were just a Mini PC with software, we'd be vulnerable to copying. We're not. The value is: (1) The mathematical models — HMM, Kalman, forces synthesis. (2) The IP protection — TPM 2.0 makes extraction infeasible. (3) The integration — seamless Schwab data flow. (4) The user experience — zero setup, zero technical skill. Hardware is the vehicle. Software is the value.
Our analytics are strictly impersonal — they don't consider the user's risk profile, portfolio size, or financial goals, which is the fundamental SEC threshold for investment advice. We use "Statistical Implied Vector" (not "Predicted Target"). We use "Historical Probability Level" (not "Trade Signal"). The decision to buy or sell remains 100% an independent human decision. Zedcrit is a quantitative indicator — like RSI or a Moving Average, just far more sophisticated.
We position it as professional, tax-deductible trading equipment — not a subscription. The psychological trigger is pain prevention: when an active options trader loses $5,000 from one bad regime misread, $799 feels completely trivial. Our early validation proves that traders suffering from misread regimes consider a sub-$1,000 upfront cost a bargain to stop the bleeding. Our ~53% blended hardware margin covers the cost effortlessly. The Terminal is designed for reliability: ultra-silent active cooling + NVMe. Before shipping, every unit undergoes an automated Burn-in QA (SMART, Memtest, 100% CPU stress test). We also use a Master Recovery Key Registry to instantly recover client data on new hardware, and a Remote Kill-Switch to wipe stolen units. The Zedcrit Care $49/month tier converts potential support issues into a profitable ~98% margin revenue stream.
We operate a self-hosted VPN network (using NetBirds / WireGuard). Commercial VPNs like Tailscale/Twingate would cost $700+/month for a 1,000-unit fleet. By self-hosting, we eliminate per-node scaling costs while maintaining secure, persistent connections for telemetry and remote support. Clients can also use this secure tunnel to access their Terminal remotely.
A SaaS business with >85% margins and 5:1 LTV/CAC generates compounding, risk-free cash flow. A prop fund carries systemic risks — black swans, broker outages, gap-downs — that no model can perfectly predict. A scalable financial data company trades at 4–6x ARR. A prop fund trades at 1–2x book. Selling the "picks and shovels" during a gold rush is always the better business.
They acquire us for the mathematical models — HMM + Forces synthesis — validated on thousands of hyper-active, profitable retail traders. Hardware is our moat while we're a startup vulnerable to IP theft. At exit, our technology is extracted from hardware into the acquirer's secure cloud infrastructure. They buy proven, battle-tested algorithmic IP and a captive, high-LTV customer base.
Data security is a core pillar of our architecture. The Terminal operates locally on the user's network and connects directly to the brokerage API using encrypted OAuth flows. No sensitive trading data or positions are ever routed through our central servers. Additionally, the hardware is secured via TPM 2.0 and LUKS full-disk encryption, making physical extraction infeasible.
1. 0DTE Explosion: 0DTE options now account for over half of all SPX volume, making real-time regime detection a mandatory requirement, not a luxury.
2. Privacy Backlash: Retail traders are increasingly rejecting cloud platforms that harvest their trading data. Our local architecture solves this natively.
3. Accessible Hardware: Mini PCs (like Ryzen 7 / Core Ultra) with 32GB RAM make our ~53% blended hardware margin possible via Amazon Prime, eliminating inventory risk.
4. First-Mover Advantage: We are the first to package institutional quant logic into a standalone, $0-data-cost edge appliance for retail.
Now is the time to invest.
Appendix
| Term | Definition |
| 0DTE | Zero Days To Expiration — options expiring the same trading day |
| HMM | Hidden Markov Model — probabilistic state machine for regime detection |
| GEX | Gamma Exposure — measure of dealer positioning from options flows |
| Call Wall | Strike with highest call open interest — acts as resistance |
| Put Wall | Strike with highest put open interest — acts as support |
| Gamma Flip | Level where dealer gamma positioning shifts from positive to negative |
| Vanna | Second-order Greek measuring how Delta changes with implied volatility, or equivalently, how Vega changes with the underlying asset price |
| Charm | Second-order Greek — how delta changes with time (theta decay of delta) |
| Liquidity Void | Price zone with minimal dealer hedging — prices move fast through these |
| Kalman Filter | Optimal recursive estimator for noisy data streams |
| BYOD | Bring Your Own Data — client uses their own API key; no data distribution liability |
| SAFE | Simple Agreement for Future Equity — convertible investment instrument |
| ARR | Annual Recurring Revenue — annualized software subscription revenue |
| LTV | Lifetime Value — total revenue expected from a single customer (20-mo: $4,073) |
| CAC | Customer Acquisition Cost — total cost to acquire one paying customer |
| TPM 2.0 | Trusted Platform Module — hardware security chip; makes IP extraction infeasible |
| LUKS | Linux Unified Key Setup — full-disk encryption layer |
| OPRA | Options Price Reporting Authority — data licensing body for options chain data |
| BKM | Bakshi-Kapadia-Madan — model-free implied variance framework |
| GPD | Generalized Pareto Distribution — extreme value theory for tail risk |
| Welford | Welford's Online Algorithm — single-pass real-time variance calculation |
Hardware: Zedcrit Core (Base Model)
| Component | Specification |
| Processor | Intel N100 (Efficient 4-core) |
| RAM | 16 GB DDR5 |
| Storage | 256 GB NVMe SSD (zero moving parts) |
| Encryption | LUKS Full Disk + TPM 2.0 hardware binding |
| Display | Turing Smart Screen (status, temps, connectivity indicator) |
| Cooling | Ultra-silent passive cooling |
| Network | Gigabit Ethernet |
| Power | 65W USB-C |
| Dimensions | ~4" × 4" × 2" · ~1.5 lbs |
Hardware: Zedcrit Pro (Performance Model)
| Component | Specification |
| Processor | Intel Core i5 or AMD Ryzen 5 (6–12 cores) |
| RAM | 32 GB DDR5 |
| Storage | 1 TB NVMe SSD (zero moving parts) |
| Encryption | LUKS Full Disk + TPM 2.0 hardware binding |
| Display | Turing Smart Screen (status, temps, connectivity indicator) |
| Cooling | Ultra-silent active cooling (necessary for 32GB DDR5 / Ryzen 7 load) |
| Network | Gigabit Ethernet |
| Power | 65W USB-C |
| Dimensions | ~4" × 4" × 2" · ~2 lbs |
Software Stack
| Layer | Technology |
| OS | Linux (hardened, minimal attack surface) |
| Orchestration | Docker Compose (K3s for Phase 4 scale) |
| Database | ClickHouse (high-performance columnar) |
| Processing | Apache PyArrow + Polars (vectorized, zero-copy) |
| API Server | FastAPI (async, WebSocket) |
| Dashboard | React (served at zedcrit.local — no app install) |
| Compilation | Nuitka (prevents Python decompilation) |
| Math Engines | HMM · Kalman Filter · Black-Scholes Greeks · Forces Synthesis |
This document is confidential and intended solely for the individual or entity to whom it is addressed. Any unauthorized review, use, disclosure, or distribution is prohibited. This document contains proprietary information and trade secrets of Zedcrit. This is not an offer to sell or a solicitation of an offer to buy any securities. Past performance and financial projections are not guarantees of future results.
Ready to Invest?
We are raising $500K on SAFE @ $5M cap, structured in 3 milestone-based tranches ($200K, $150K, $150K).
We respond within 24 hours. All documents are confidential.